Deutsch
 English
 Español
 Français
 Italiano
 Nederlands
 Polski
 Português
 Русский
 Türkçe
 Svenska
 Chinese
 Magyar
Alienware 13 R3 笔记本电脑简短评测
| Networking | |
| iperf3 transmit AX12 | |
| Razer Blade (2016) | |
| Alienware 13 R3 | |
| iperf3 receive AX12 | |
| Alienware 13 R3 | |
| Razer Blade (2016) | |
| |||||||||||||||||||||||||
Brightness Distribution: 87 %
Center on Battery: 313 cd/m²
Contrast: ∞:1 (Black: 0 cd/m²)
ΔE Color 2.54 | 0.5-29.43 Ø5
ΔE Greyscale 1.43 | 0.57-98 Ø5.3
97% sRGB (Argyll 1.6.3 3D)
78% AdobeRGB 1998 (Argyll 1.6.3 3D)
Gamma: 2.3
| Alienware 13 R3 JJT6C_133KL05 (SDCA029), 2560x1440, 13.30 | Razer Blade (2016) Sharp LQ140Z1JW01 (SHP1401), 3200x1800, 14.00 | MSI GS43VR 6RE-006US Name: LG Philips LP140WF3-SPD1, ID: LGD046D, 1920x1080, 14.00 | SCHENKER XMG P406 LG Philips 140WF1 (LGD040A), 1920x1080, 14.00 | Aorus X3 Plus v5 3200x1800, 13.90 | |
|---|---|---|---|---|---|
| Display | |||||
| Display P3 Coverage | 66.9 | 65.5 | 66.2 | 67.9 | |
| sRGB Coverage | 96.8 | 86.4 | 82.8 | 98.2 | |
| AdobeRGB 1998 Coverage | 68.2 | 63.1 | 60.5 | 69.2 | |
| Response Times | -619% | -771% | -971% | -802% | |
| Response Time Grey 50% / Grey 80% * | 41 ? | 31.6 ? | 56 ? | 52.4 ? | |
| Response Time Black / White * | 2.8 ? | 37 ? -1221% | 24.4 ? -771% | 30 ? -971% | 47.2 ? -1586% |
| PWM Frequency | 240 ? | 200 ? -17% | 198 ? -17% | ||
| Screen | -1% | -17% | -65% | -46% | |
| Brightness middle | 313 | 328 5% | 288.4 -8% | 282 -10% | 394.8 26% |
| Brightness | 310 | 328 6% | 282 -9% | 266 -14% | 370 19% |
| Brightness Distribution | 87 | 69 -21% | 83 -5% | 81 -7% | 79 -9% |
| Black Level * | 0.22 | 0.35 | 0.22 | 0.293 | |
| Colorchecker dE 2000 * | 2.54 | 1.91 25% | 2.61 -3% | 4.98 -96% | 4.8 -89% |
| Colorchecker dE 2000 max. * | 3.94 | 3.23 18% | 7.34 -86% | 10.2 -159% | |
| Greyscale dE 2000 * | 1.43 | 1.69 -18% | 1.18 17% | 4.08 -185% | 5.04 -252% |
| Gamma | 2.3 96% | 2.3 96% | 2.24 98% | 2.51 88% | 2.26 97% |
| CCT | 6337 103% | 6418 101% | 6506 100% | 5877 111% | 7343 89% |
| Color Space (Percent of AdobeRGB 1998) | 78 | 63 -19% | 56.4 -28% | 54 -31% | 63.4 -19% |
| Color Space (Percent of sRGB) | 97 | 97 0% | 86.4 -11% | 83 -14% | 98.1 1% |
| Contrast | 1491 | 824 | 1282 | 1347 | |
| Total Average (Program / Settings) | -310% /
-124% | -394% /
-100% | -518% /
-165% | -424% /
-214% |
* ... smaller is better
Display Response Times
| ↔ Response Time Black to White | ||
|---|---|---|
| 2.8 ms ... rise ↗ and fall ↘ combined | ↗ 1.2 ms rise | 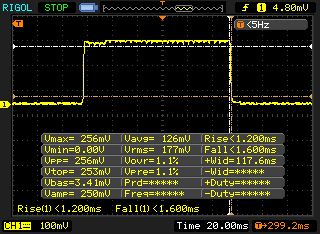 |
| ↘ 1.6 ms fall | ||
| The screen shows very fast response rates in our tests and should be very well suited for fast-paced gaming. In comparison, all tested devices range from 0.1 (minimum) to 240 (maximum) ms. » 8 % of all devices are better. This means that the measured response time is better than the average of all tested devices (21.5 ms). | ||
Screen Flickering / PWM (Pulse-Width Modulation)
| Screen flickering / PWM detected | 240 Hz | ≤ 100 % brightness setting | 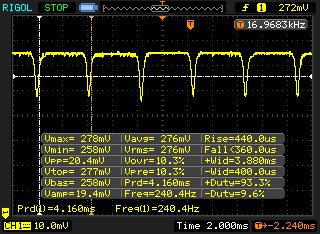 |
The display backlight flickers at 240 Hz (worst case, e.g., utilizing PWM) Flickering detected at a brightness setting of 100 % and below. There should be no flickering or PWM above this brightness setting. The frequency of 240 Hz is relatively low, so sensitive users will likely notice flickering and experience eyestrain at the stated brightness setting and below. In comparison: 53 % of all tested devices do not use PWM to dim the display. If PWM was detected, an average of 17924 (minimum: 5 - maximum: 3846000) Hz was measured. | |||
| Cinebench R15 | |
| CPU Single 64Bit | |
| Alienware 13 R3 | |
| Razer Blade (2016) | |
| SCHENKER XMG P406 | |
| Aorus X3 Plus v5 | |
| MSI GS43VR 6RE-006US | |
| CPU Multi 64Bit | |
| Alienware 13 R3 | |
| Aorus X3 Plus v5 | |
| SCHENKER XMG P406 | |
| MSI GS43VR 6RE-006US | |
| Razer Blade (2016) | |
| Cinebench R11.5 | |
| CPU Single 64Bit | |
| Alienware 13 R3 | |
| Aorus X3 Plus v5 | |
| SCHENKER XMG P406 | |
| MSI GS43VR 6RE-006US | |
| CPU Multi 64Bit | |
| Alienware 13 R3 | |
| Aorus X3 Plus v5 | |
| SCHENKER XMG P406 | |
| MSI GS43VR 6RE-006US | |
| PCMark 8 | |
| Home Score Accelerated v2 | |
| Aorus X3 Plus v5 | |
| MSI GS43VR 6RE-006US | |
| Alienware 13 R3 | |
| Razer Blade (2016) | |
| SCHENKER XMG P406 | |
| Work Score Accelerated v2 | |
| SCHENKER XMG P406 | |
| Alienware 13 R3 | |
| MSI GS43VR 6RE-006US | |
| Aorus X3 Plus v5 | |
| Razer Blade (2016) | |
| PCMark 7 - Score | |
| SCHENKER XMG P406 | |
| Alienware 13 R3 | |
| Aorus X3 Plus v5 | |
| PCMark 7 Score | 5482 points | |
| PCMark 8 Home Score Accelerated v2 | 3894 points | |
| PCMark 8 Creative Score Accelerated v2 | 5200 points | |
| PCMark 8 Work Score Accelerated v2 | 4799 points | |
Help | ||
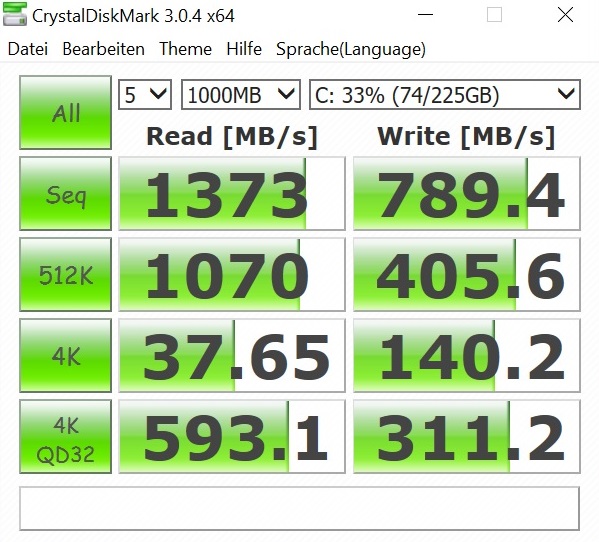
| Alienware 13 R3 Toshiba NVMe THNSN5256GPUK | Razer Blade (2016) Samsung PM951 NVMe MZVLV512 | MSI GS43VR 6RE-006US SanDisk SD8SN8U1T001122 | SCHENKER XMG P406 Samsung SM951 MZHPV256HDGL m.2 PCI-e | Aorus X3 Plus v5 Samsung SM951 MZVPV512HDGL m.2 PCI-e | |
|---|---|---|---|---|---|
| CrystalDiskMark 3.0 | 5% | -62% | 31% | 57% | |
| Read Seq | 1373 | 1296 -6% | 335.3 -76% | 1634 19% | 1529 11% |
| Write Seq | 789 | 603 -24% | 299 -62% | 1290 63% | 1565 98% |
| Read 512 | 1070 | 655 -39% | 223 -79% | 1149 7% | 929 -13% |
| Write 512 | 405.6 | 604 49% | 246.7 -39% | 1285 217% | 1536 279% |
| Read 4k | 37.65 | 42.22 12% | 17.68 -53% | 43.82 16% | 51.7 37% |
| Write 4k | 140.2 | 139.6 0% | 35.31 -75% | 110.3 -21% | 147.2 5% |
| Read 4k QD32 | 593 | 573 -3% | 247.4 -58% | 320.5 -46% | 636 7% |
| Write 4k QD32 | 311.2 | 480 54% | 156.3 -50% | 287.3 -8% | 421.4 35% |

| 3DMark | |
| 2560x1440 Time Spy Graphics | |
| Alienware 13 R3 | |
| 1920x1080 Fire Strike Graphics | |
| MSI GS43VR 6RE-006US | |
| Alienware 13 R3 | |
| Razer Blade (2016) | |
| SCHENKER XMG P406 | |
| Aorus X3 Plus v5 | |
| 3DMark 11 - 1280x720 Performance GPU | |
| MSI GS43VR 6RE-006US | |
| Alienware 13 R3 | |
| Razer Blade (2016) | |
| SCHENKER XMG P406 | |
| Aorus X3 Plus v5 | |
| Unigine Heaven 4.0 - Extreme Preset DX11 | |
| Alienware 13 R3 | |
| 3DMark 11 Performance | 12319 points | |
| 3DMark Cloud Gate Standard Score | 21924 points | |
| 3DMark Fire Strike Score | 9584 points | |
| 3DMark Time Spy Score | 3630 points | |
Help | ||
| The Division | |
| 1920x1080 Ultra Preset AF:16x | |
| Alienware 13 R3 | |
| Razer Blade (2016) FHD | |
| 1920x1080 High Preset AF:8x | |
| Alienware 13 R3 | |
| Razer Blade (2016) FHD | |
| XCOM 2 | |
| 1920x1080 Maximum Preset (8xMSAA instead of FXAA) AA:8xMS AF:16x | |
| Alienware 13 R3 | |
| Razer Blade (2016) FHD | |
| 1920x1080 High Preset AA:FX AF:8x | |
| Alienware 13 R3 | |
| Razer Blade (2016) FHD | |
| Battlefield 1 | |
| 1920x1080 Ultra Preset AA:T | |
| Alienware 13 R3 | |
| 1920x1080 High Preset AA:T | |
| Alienware 13 R3 | |
| Mirror's Edge Catalyst | |
| 1920x1080 Ultra Preset AF:16x | |
| Alienware 13 R3 | |
| 1920x1080 High Preset AF:16x | |
| Alienware 13 R3 | |
| Resident Evil 7 | |
| 1920x1080 Very High / On AA:FXAA+T | |
| Alienware 13 R3 | |
| 1920x1080 High / On AA:FXAA+T | |
| Alienware 13 R3 | |
| Watch Dogs 2 | |
| 1920x1080 Ultra Preset | |
| Alienware 13 R3 | |
| 1920x1080 High Preset | |
| Alienware 13 R3 | |
| Call of Duty Infinite Warfare | |
| 1920x1080 Ultra / On AA:T2X SM | |
| Alienware 13 R3 | |
| 1920x1080 High / On AA:FX | |
| Alienware 13 R3 | |
| Mafia 3 - 1920x1080 High Preset | |
| Alienware 13 R3 | |
| low | med. | high | ultra | |
| XCOM 2 (2016) | 56.8 | 29.1 | ||
| The Division (2016) | 67.4 | 52.2 | ||
| Need for Speed 2016 (2016) | 80 | 63.1 | ||
| Mirror's Edge Catalyst (2016) | 69.7 | 63.9 | ||
| Mafia 3 (2016) | 40.1 | |||
| Battlefield 1 (2016) | 77.7 | 72.9 | ||
| Farming Simulator 17 (2016) | 144 | 139 | ||
| Call of Duty Infinite Warfare (2016) | 94.7 | 84.4 | ||
| Watch Dogs 2 (2016) | 58.1 | 41.7 | ||
| Resident Evil 7 (2017) | 101 | 82 |
Noise Level
| Idle |
| 29 / 30 / 31 dB(A) |
| Load |
| 36 / 49 dB(A) |
 | ||
30 dB silent 40 dB(A) audible 50 dB(A) loud |
||
min: | ||
| Alienware 13 R3 GeForce GTX 1060 Mobile, i7-7700HQ | Razer Blade (2016) GeForce GTX 1060 Mobile, 6700HQ | MSI GS43VR 6RE-006US GeForce GTX 1060 Mobile, 6700HQ | SCHENKER XMG P406 GeForce GTX 970M, 6700HQ | Aorus X3 Plus v5 GeForce GTX 970M, 6700HQ | |
|---|---|---|---|---|---|
| Noise | -8% | -12% | -15% | -9% | |
| off / environment * | 29 | 30 -3% | 29.1 -0% | ||
| Idle Minimum * | 29 | 31 -7% | 32 -10% | 30 -3% | 32.1 -11% |
| Idle Average * | 30 | 33 -10% | 32 -7% | 32 -7% | 32.4 -8% |
| Idle Maximum * | 31 | 35 -13% | 33.5 -8% | 40 -29% | 32.5 -5% |
| Load Average * | 36 | 39 -8% | 50 -39% | 47 -31% | 40.1 -11% |
| Load Maximum * | 49 | 51 -4% | 51.5 -5% | 51 -4% | 54.6 -11% |
* ... smaller is better
(-) The maximum temperature on the upper side is 48.8 °C / 120 F, compared to the average of 40.4 °C / 105 F, ranging from 21.2 to 68.8 °C for the class Gaming.
(-) The bottom heats up to a maximum of 60.4 °C / 141 F, compared to the average of 43.2 °C / 110 F
(+) In idle usage, the average temperature for the upper side is 28.2 °C / 83 F, compared to the device average of 33.8 °C / 93 F.
(+) The palmrests and touchpad are reaching skin temperature as a maximum (34.5 °C / 94.1 F) and are therefore not hot.
(-) The average temperature of the palmrest area of similar devices was 28.9 °C / 84 F (-5.6 °C / -10.1 F).
| Alienware 13 R3 GeForce GTX 1060 Mobile, i7-7700HQ | Razer Blade (2016) GeForce GTX 1060 Mobile, 6700HQ | MSI GS43VR 6RE-006US GeForce GTX 1060 Mobile, 6700HQ | SCHENKER XMG P406 GeForce GTX 970M, 6700HQ | Aorus X3 Plus v5 GeForce GTX 970M, 6700HQ | |
|---|---|---|---|---|---|
| Heat | 7% | -10% | -15% | 18% | |
| Maximum Upper Side * | 48.8 | 52.7 -8% | 55.6 -14% | 55 -13% | 44.6 9% |
| Maximum Bottom * | 60.4 | 48.4 20% | 62.4 -3% | 58.7 3% | 49.8 18% |
| Idle Upper Side * | 33.1 | 29.3 11% | 33.2 -0% | 36.9 -11% | 24.8 25% |
| Idle Bottom * | 30.1 | 28.4 6% | 37.2 -24% | 41.7 -39% | 24.8 18% |
* ... smaller is better
Alienware 13 R3 audio analysis
(±) | speaker loudness is average but good (79 dB)
Bass 100 - 315 Hz
(±) | reduced bass - on average 14.8% lower than median
(±) | linearity of bass is average (10% delta to prev. frequency)
Mids 400 - 2000 Hz
(+) | balanced mids - only 3.8% away from median
(+) | mids are linear (6.2% delta to prev. frequency)
Highs 2 - 16 kHz
(+) | balanced highs - only 3.6% away from median
(+) | highs are linear (6.9% delta to prev. frequency)
Overall 100 - 16.000 Hz
(±) | linearity of overall sound is average (18.4% difference to median)
Compared to same class
» 56% of all tested devices in this class were better, 9% similar, 36% worse
» The best had a delta of 6%, average was 18%, worst was 132%
Compared to all devices tested
» 35% of all tested devices were better, 8% similar, 57% worse
» The best had a delta of 4%, average was 25%, worst was 134%
Razer Blade (2016) audio analysis
(±) | speaker loudness is average but good (79 dB)
Bass 100 - 315 Hz
(±) | reduced bass - on average 8.4% lower than median
(±) | linearity of bass is average (11.2% delta to prev. frequency)
Mids 400 - 2000 Hz
(+) | balanced mids - only 4.6% away from median
(+) | mids are linear (4.3% delta to prev. frequency)
Highs 2 - 16 kHz
(+) | balanced highs - only 4.3% away from median
(+) | highs are linear (5.5% delta to prev. frequency)
Overall 100 - 16.000 Hz
(±) | linearity of overall sound is average (17.1% difference to median)
Compared to same class
» 43% of all tested devices in this class were better, 12% similar, 45% worse
» The best had a delta of 6%, average was 18%, worst was 132%
Compared to all devices tested
» 26% of all tested devices were better, 8% similar, 67% worse
» The best had a delta of 4%, average was 25%, worst was 134%
| Off / Standby | |
| Idle | |
| Load |
|
| Alienware 13 R3 GeForce GTX 1060 Mobile, i7-7700HQ | Razer Blade (2016) GeForce GTX 1060 Mobile, 6700HQ | MSI GS43VR 6RE-006US GeForce GTX 1060 Mobile, 6700HQ | SCHENKER XMG P406 GeForce GTX 970M, 6700HQ | Aorus X3 Plus v5 GeForce GTX 970M, 6700HQ | |
|---|---|---|---|---|---|
| Power Consumption | -8% | -36% | -30% | ||
| Idle Minimum * | 7 | 9 -29% | 12.1 -73% | 12 -71% | |
| Idle Average * | 12 | 14 -17% | 19 -58% | 16 -33% | |
| Idle Maximum * | 18 | 22 -22% | 19.5 -8% | 22 -22% | |
| Load Average * | 76 | 72 5% | 106.7 -40% | 90 -18% | |
| Load Maximum * | 161 | 124 23% | 159 1% | 170 -6% |
* ... smaller is better
| Alienware 13 R3 GeForce GTX 1060 Mobile, i7-7700HQ, 76 Wh | Razer Blade (2016) GeForce GTX 1060 Mobile, 6700HQ, 70 Wh | MSI GS43VR 6RE-006US GeForce GTX 1060 Mobile, 6700HQ, 61 Wh | SCHENKER XMG P406 GeForce GTX 970M, 6700HQ, 45 Wh | Aorus X3 Plus v5 GeForce GTX 970M, 6700HQ, 73 Wh | |
|---|---|---|---|---|---|
| Battery Runtime | -24% | -7% | -35% | -17% | |
| Reader / Idle | 524 | 577 10% | 275 -48% | 481 -8% | |
| H.264 | 358 | ||||
| WiFi v1.3 | 320 | 243 -24% | 261 -18% | 197 -38% | 305 -5% |
| Load | 90 | 78 -13% | 72 -20% | 55 -39% |
Pros
Cons
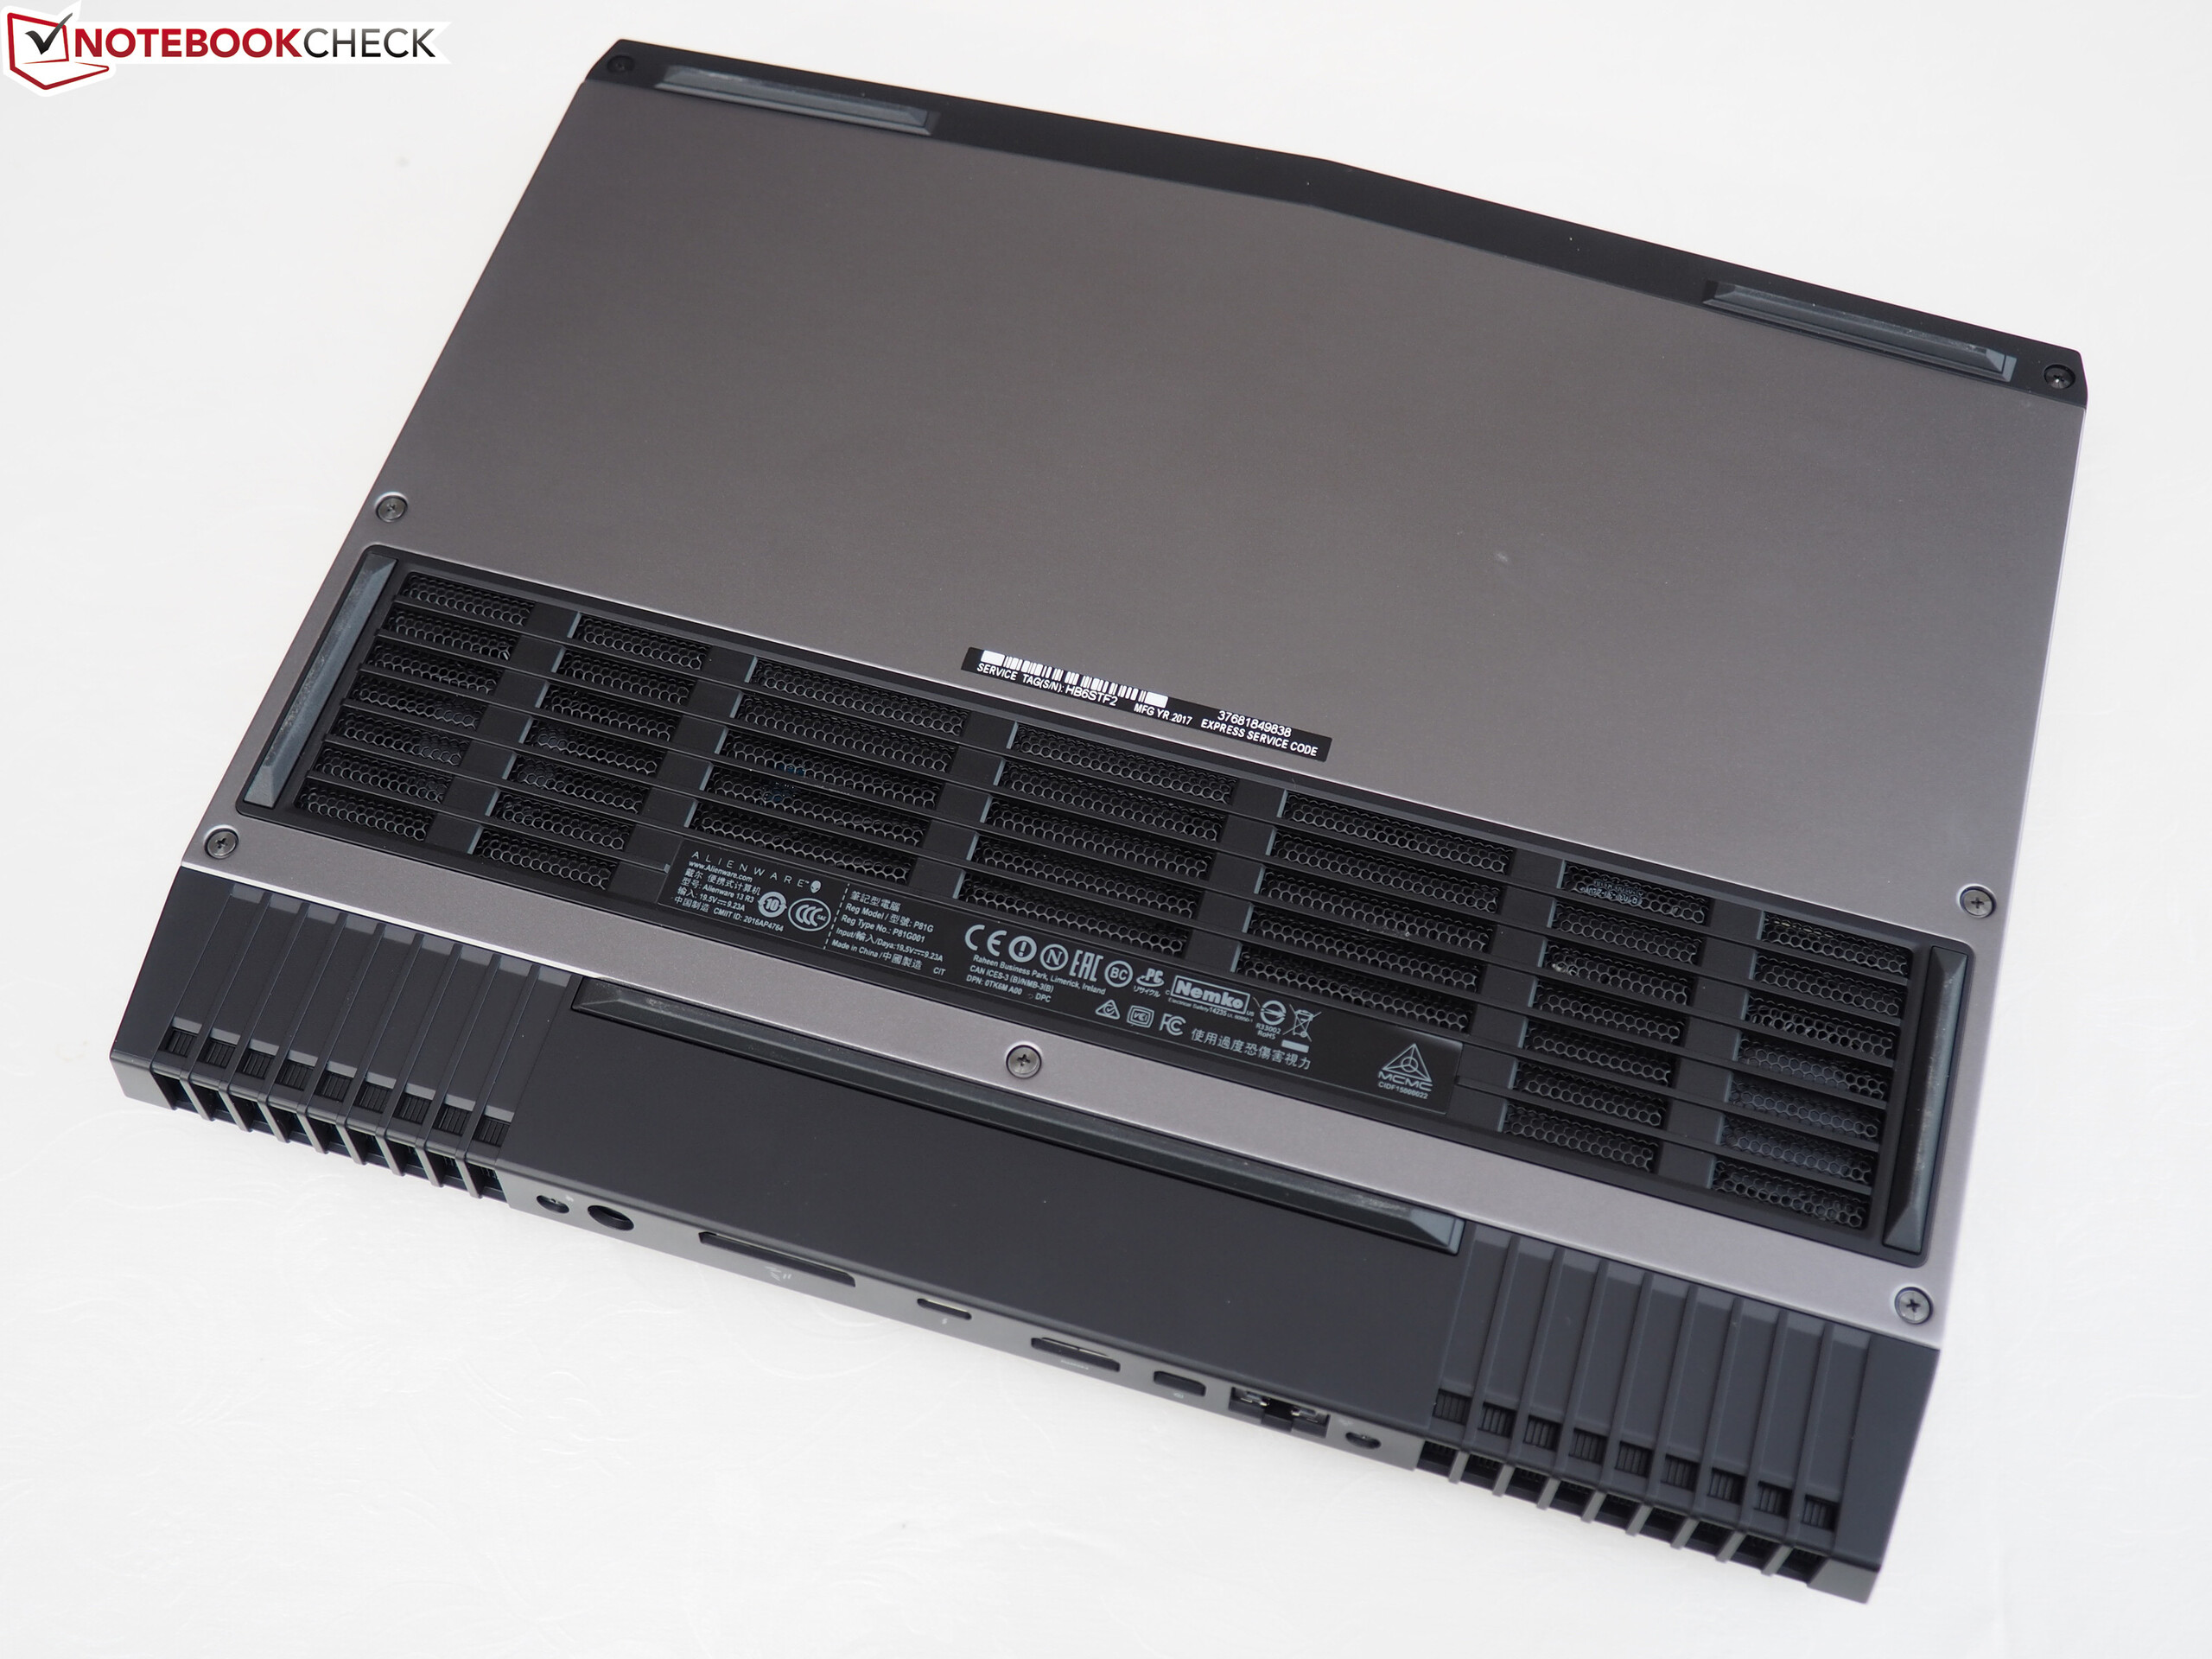
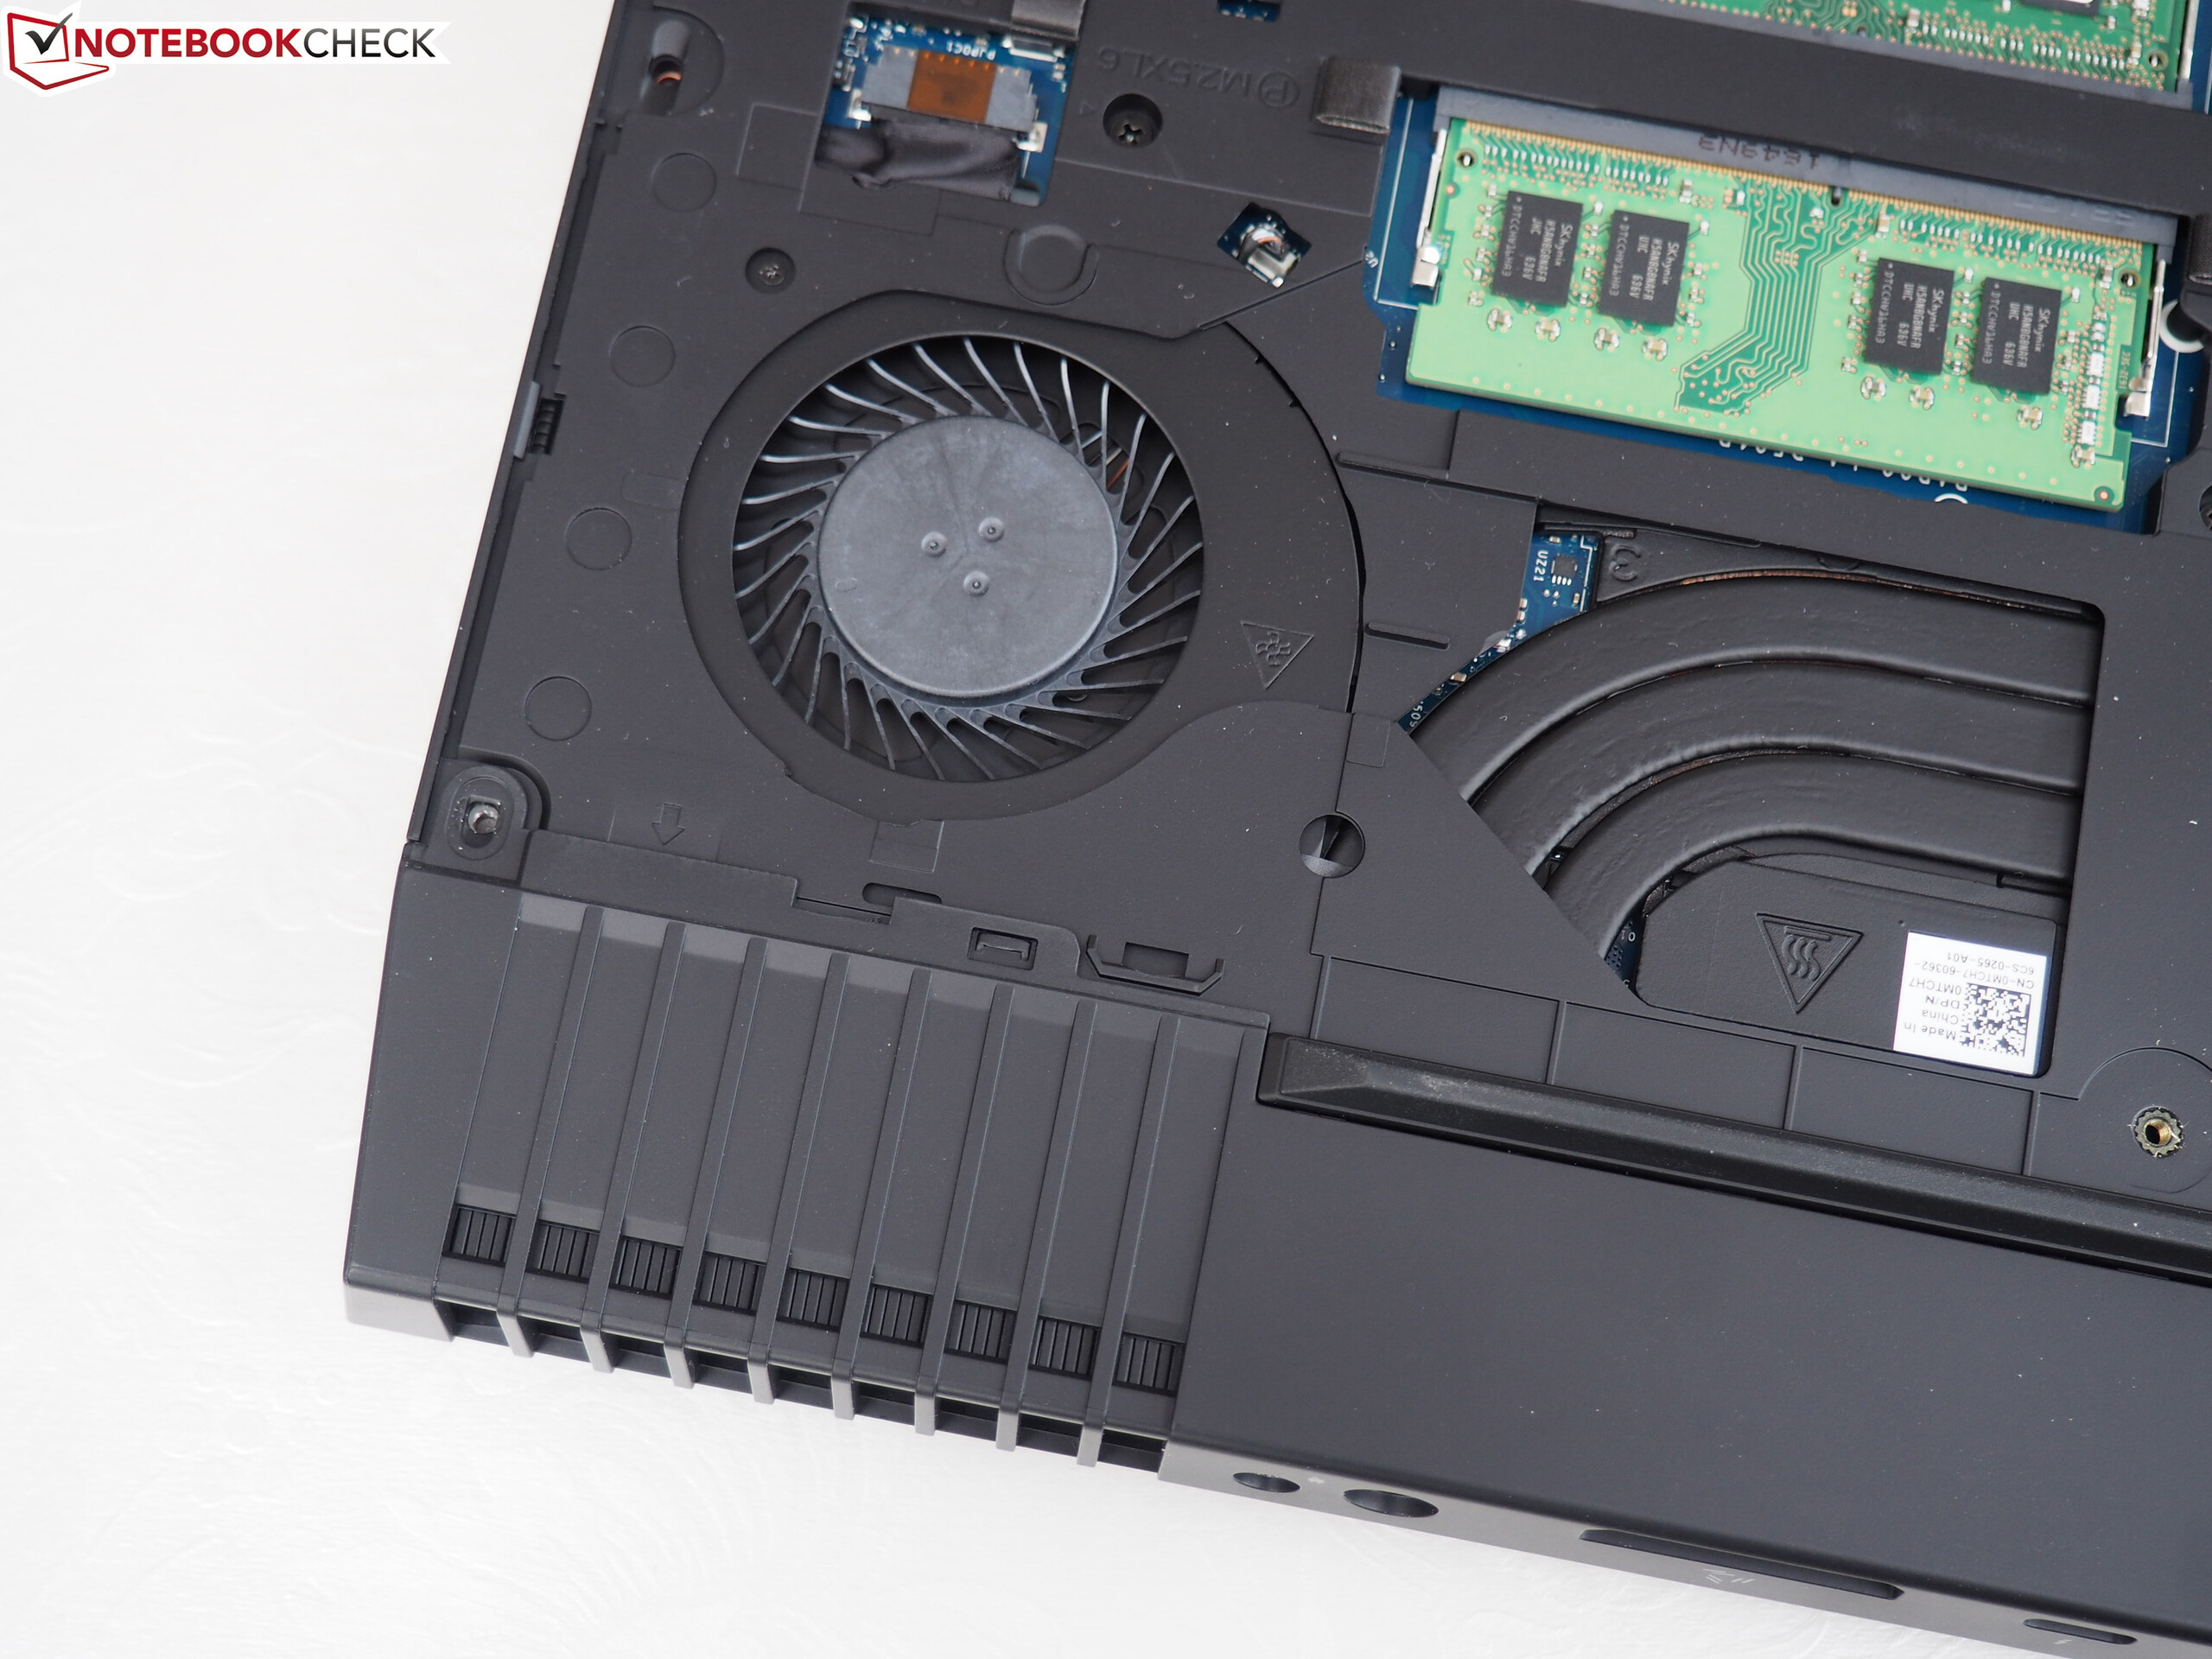
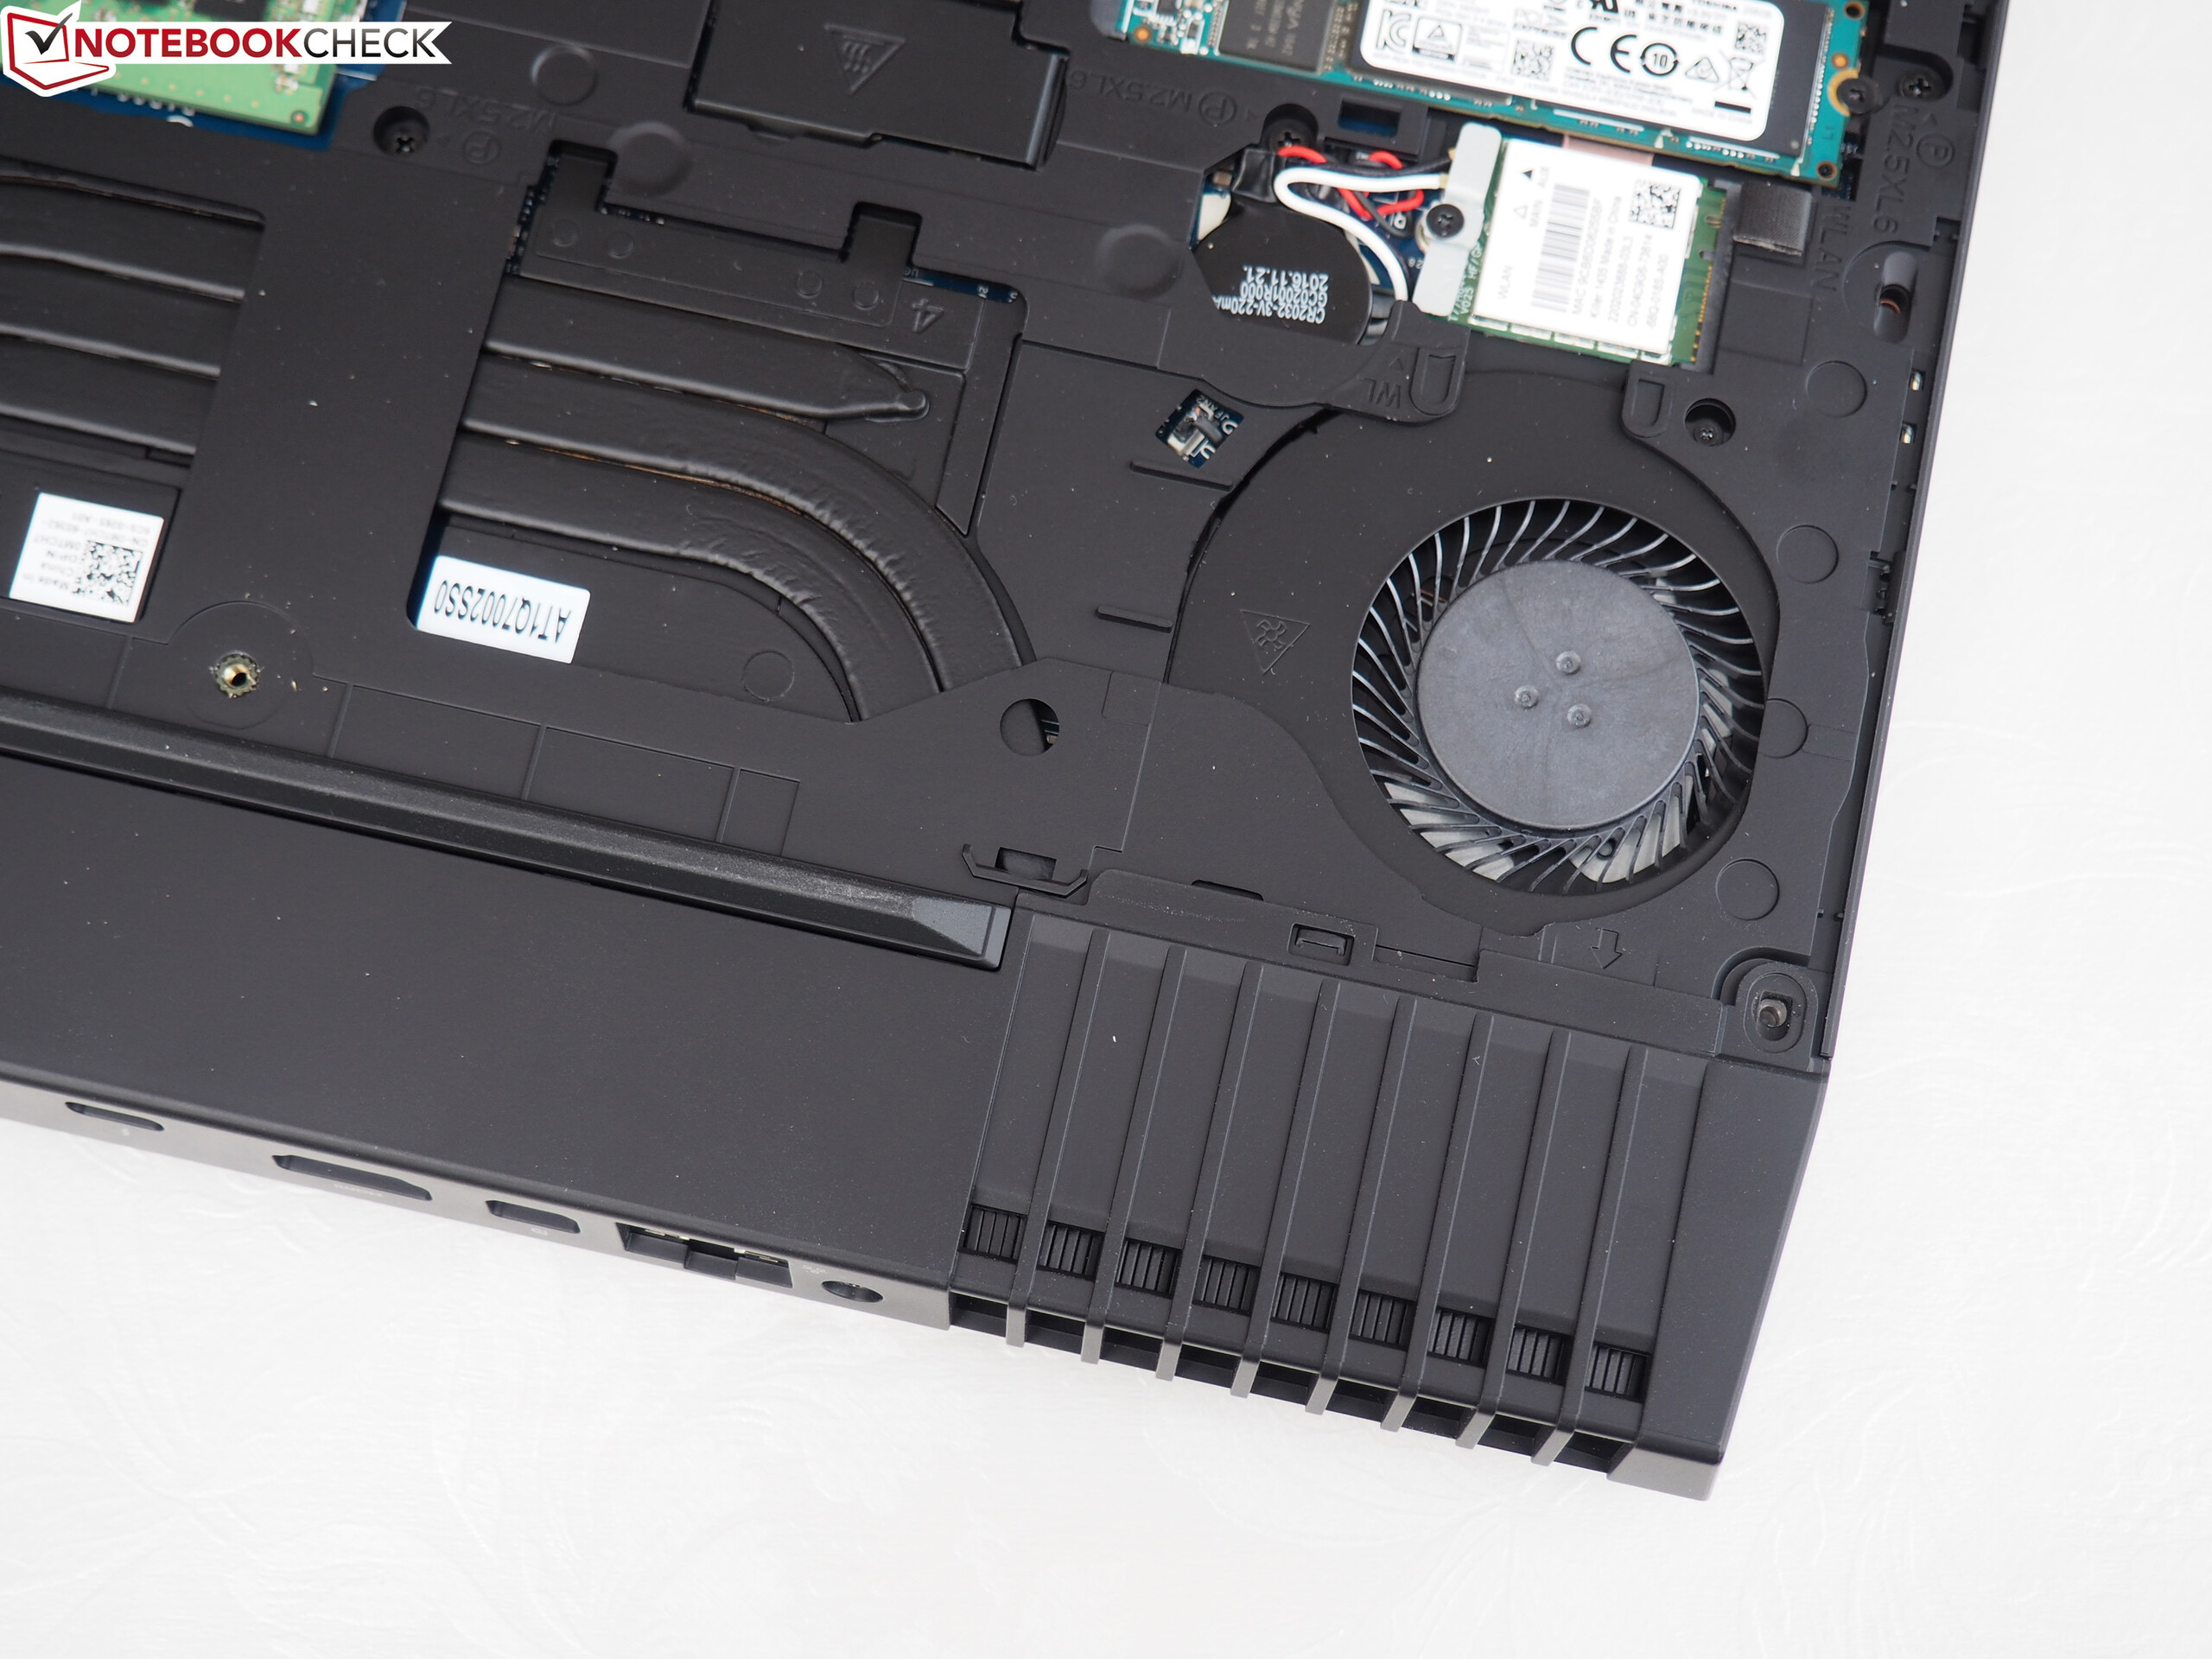
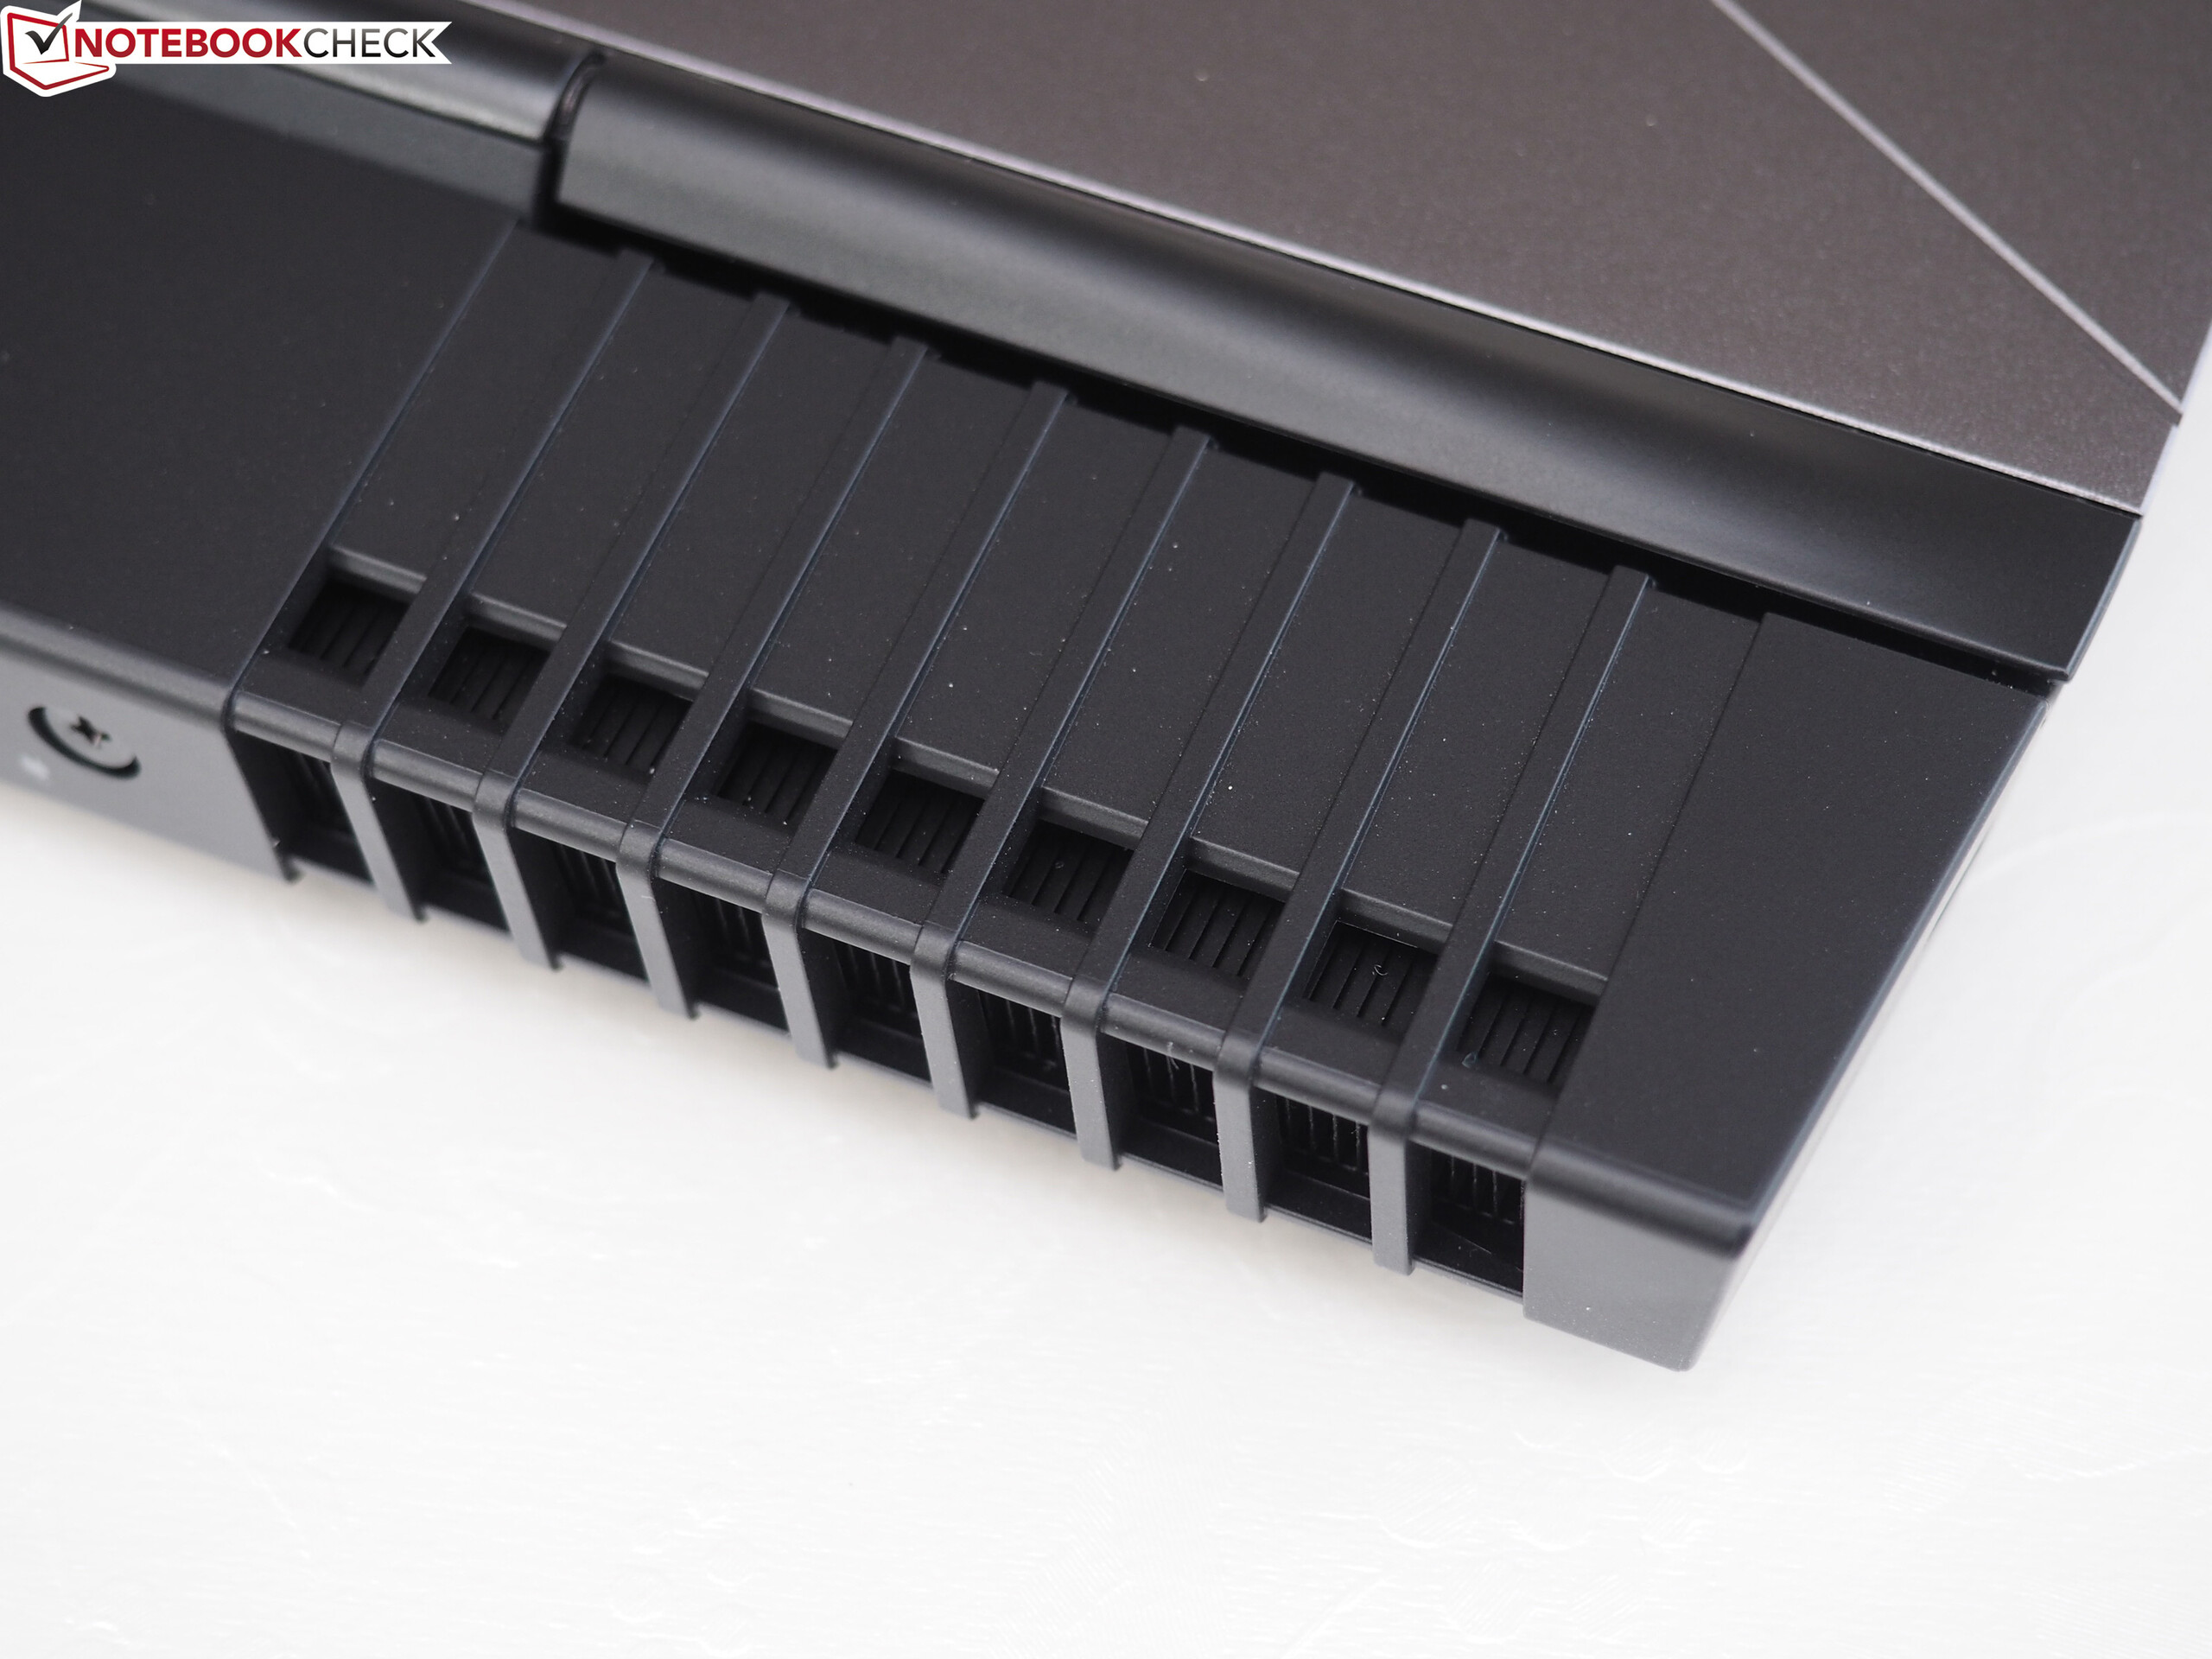
尽管尺寸较大的机型在我们的测试中遇到了一些散热问题(不稳定且较高的处理器温度,待机时的不必要风扇噪音,负载下的高发热量),这台较小的13寸设备并没有任何问题。当然,Alienware 13 R3在极端负载下也十分吵闹、温度较高,不过在其他情况下整个系统都十分安静清凉。
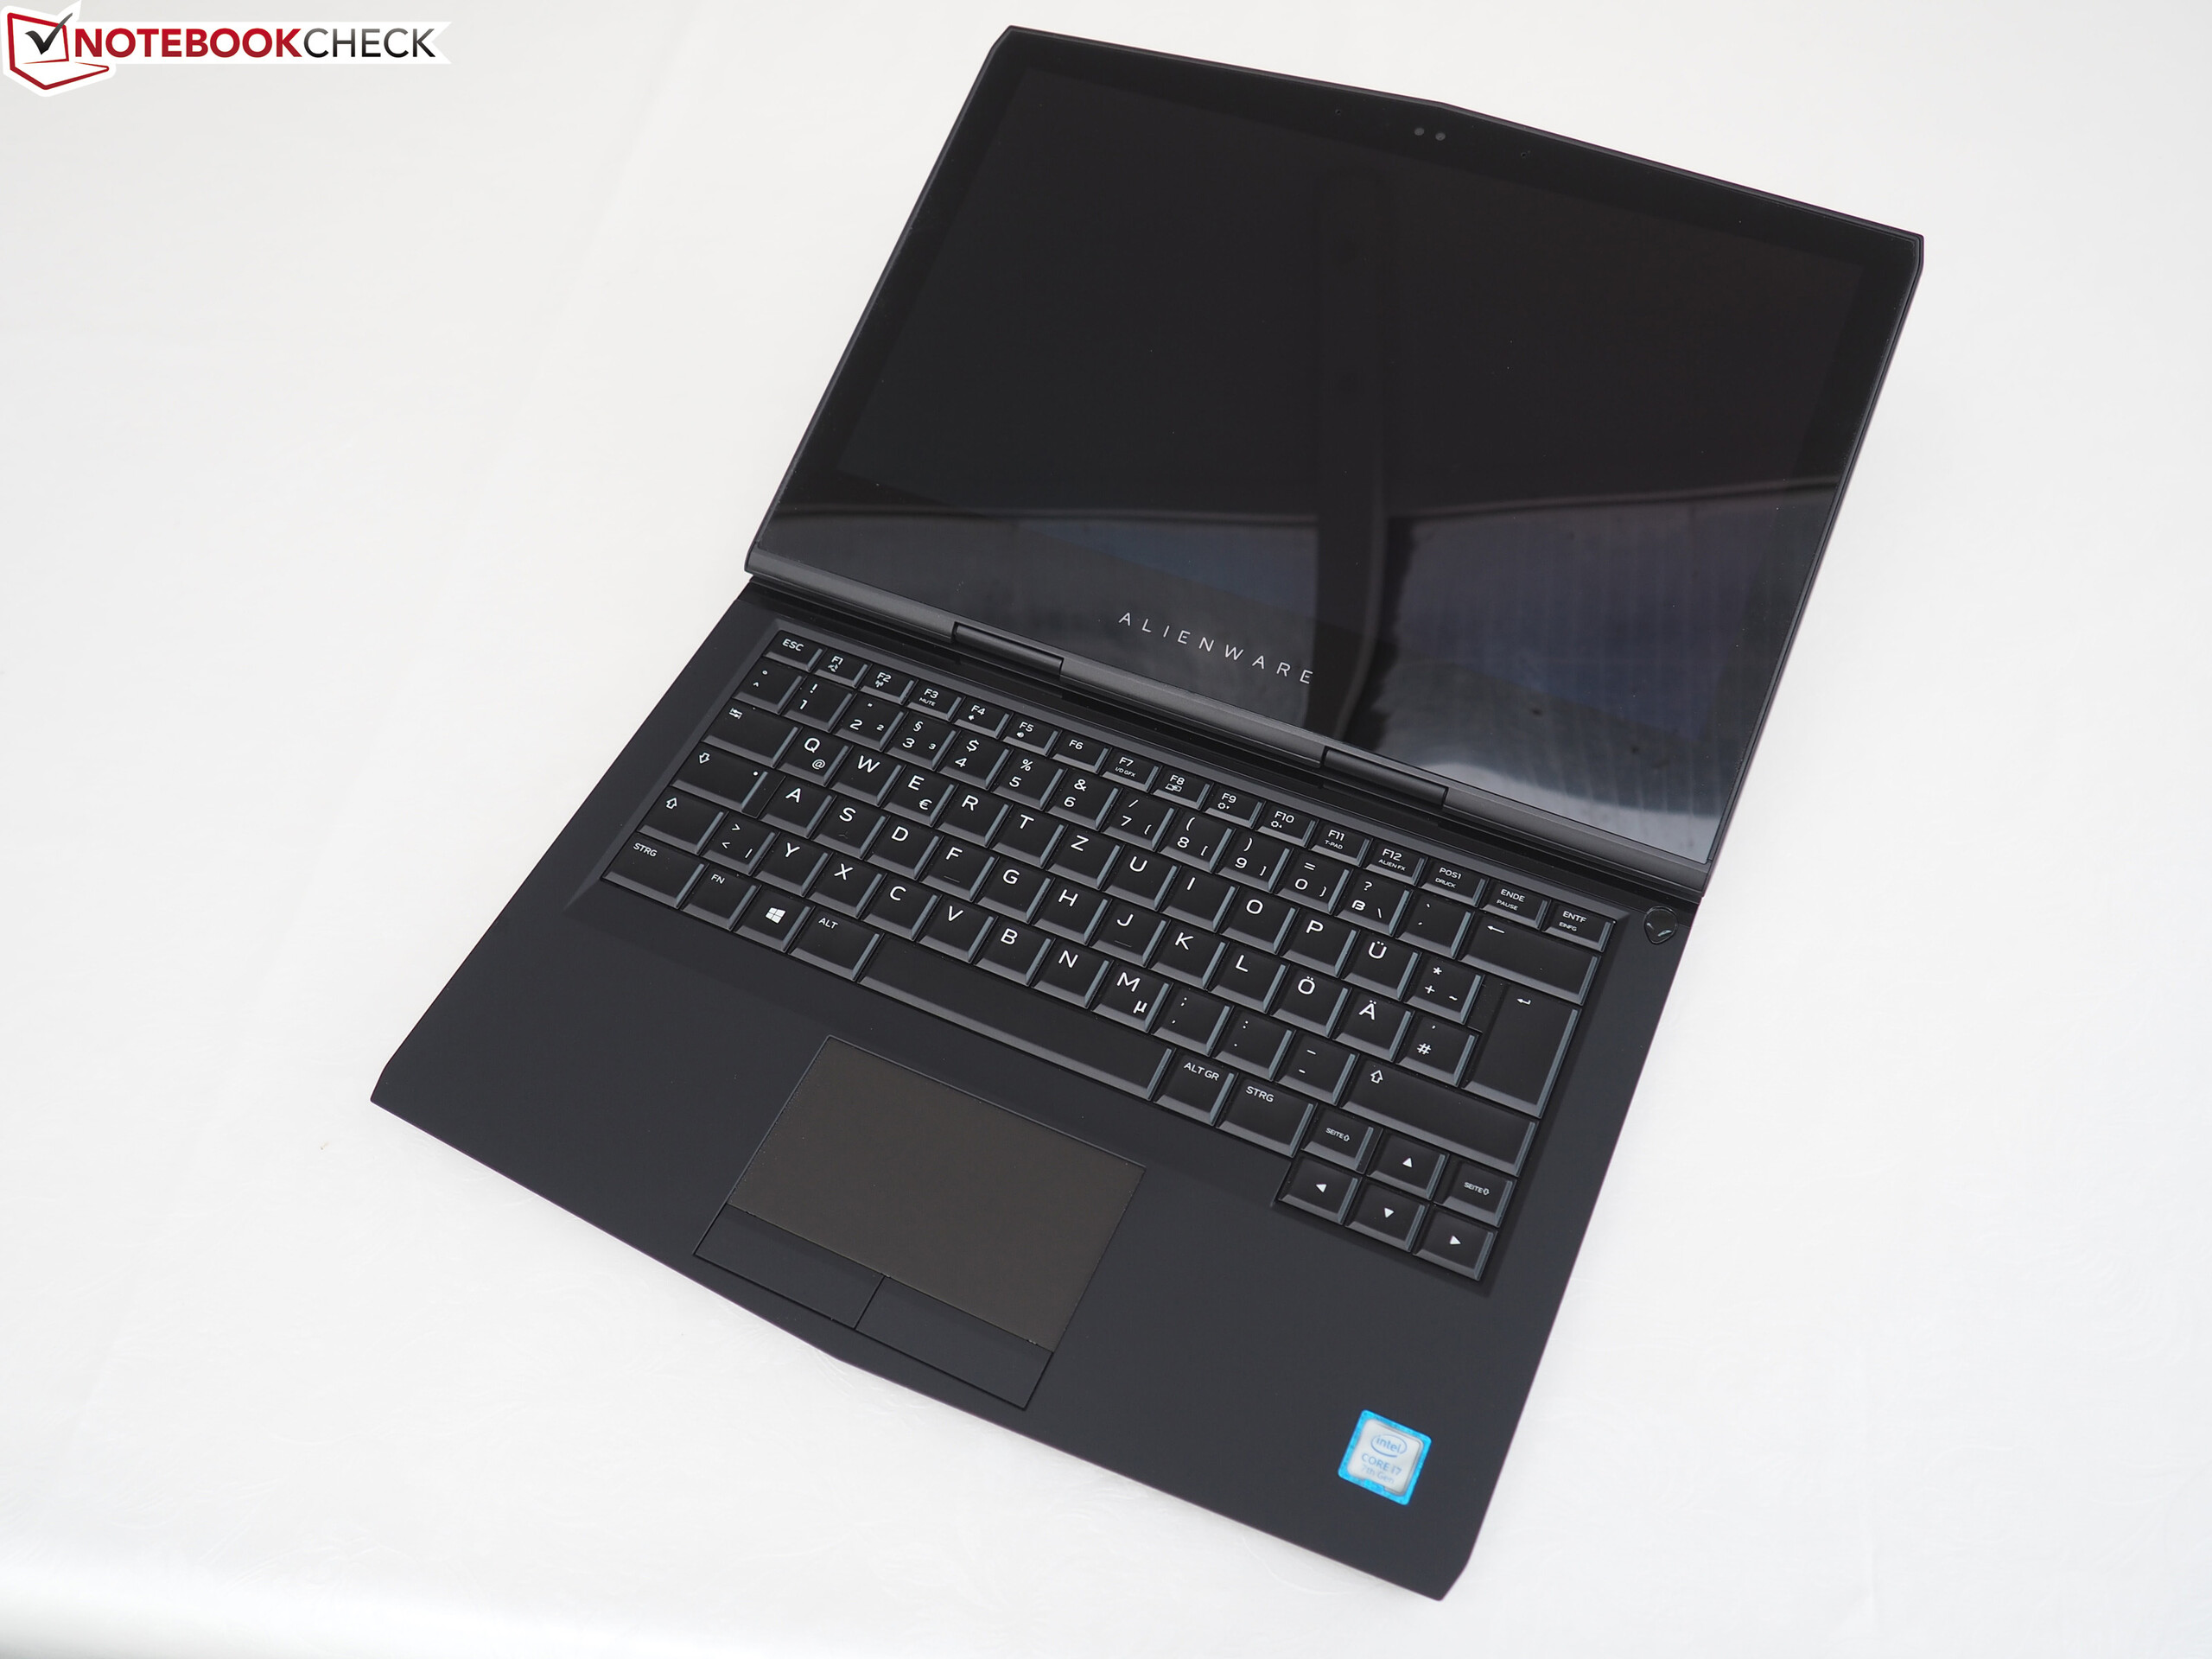
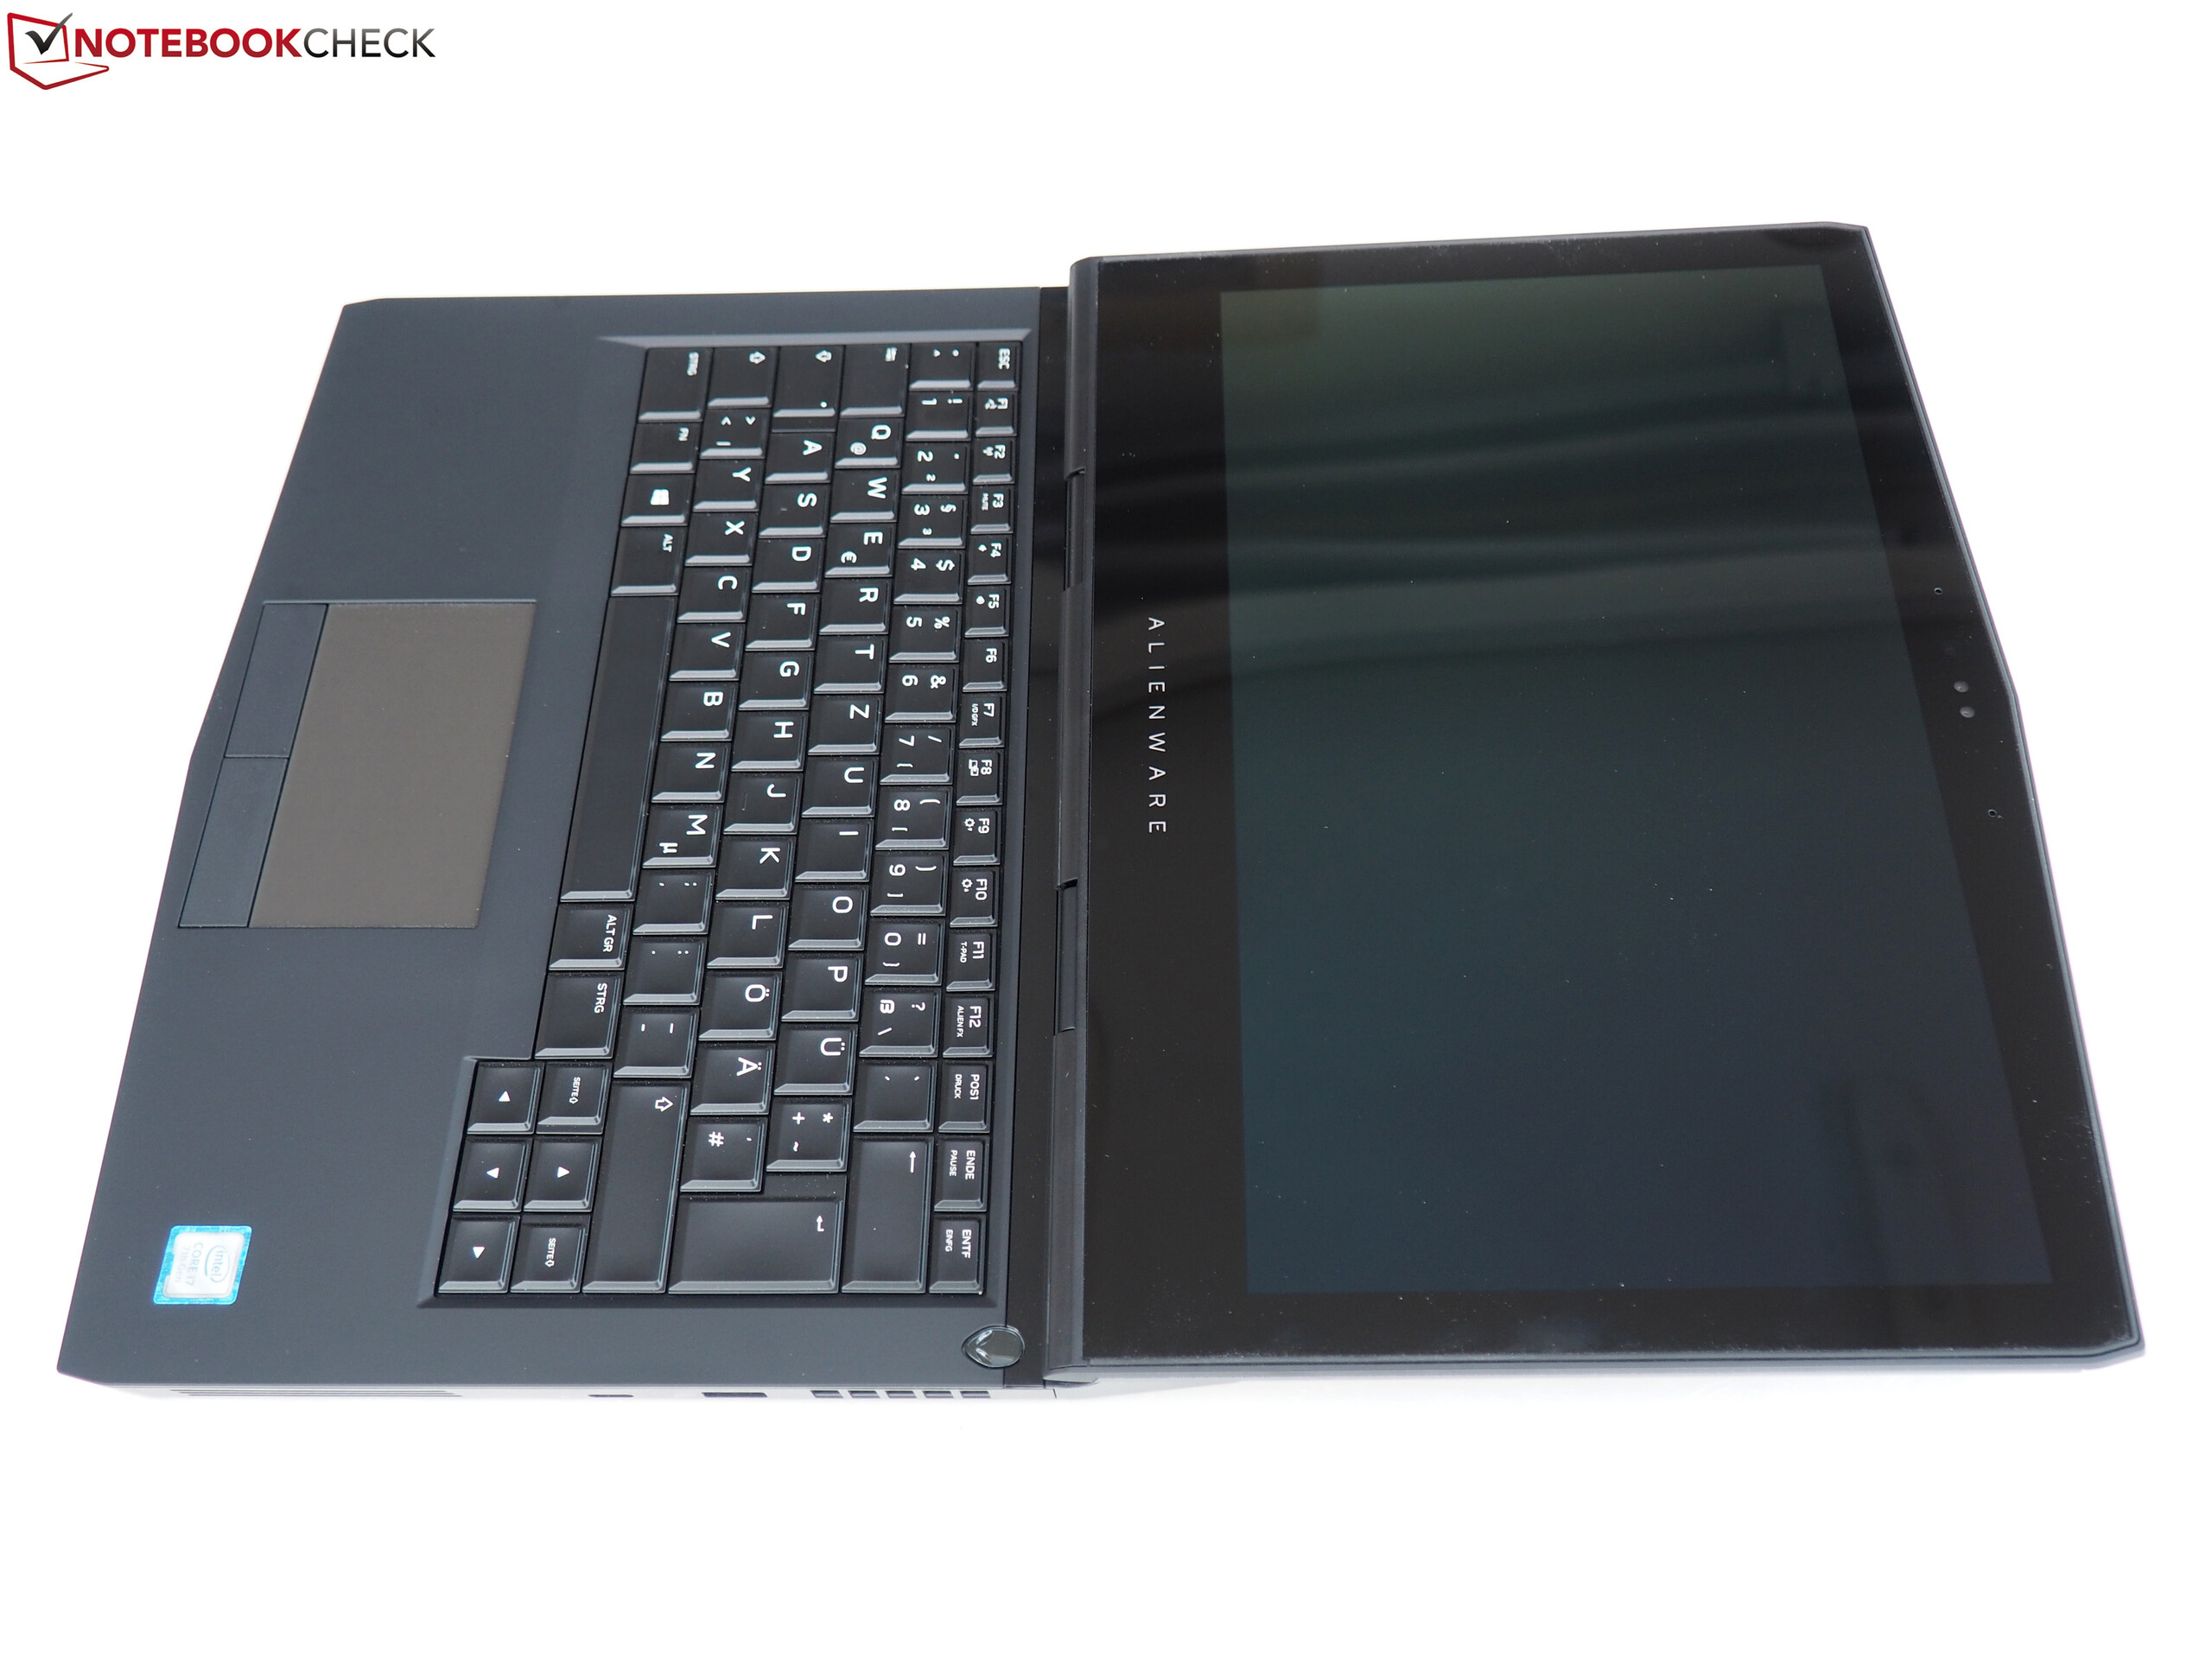
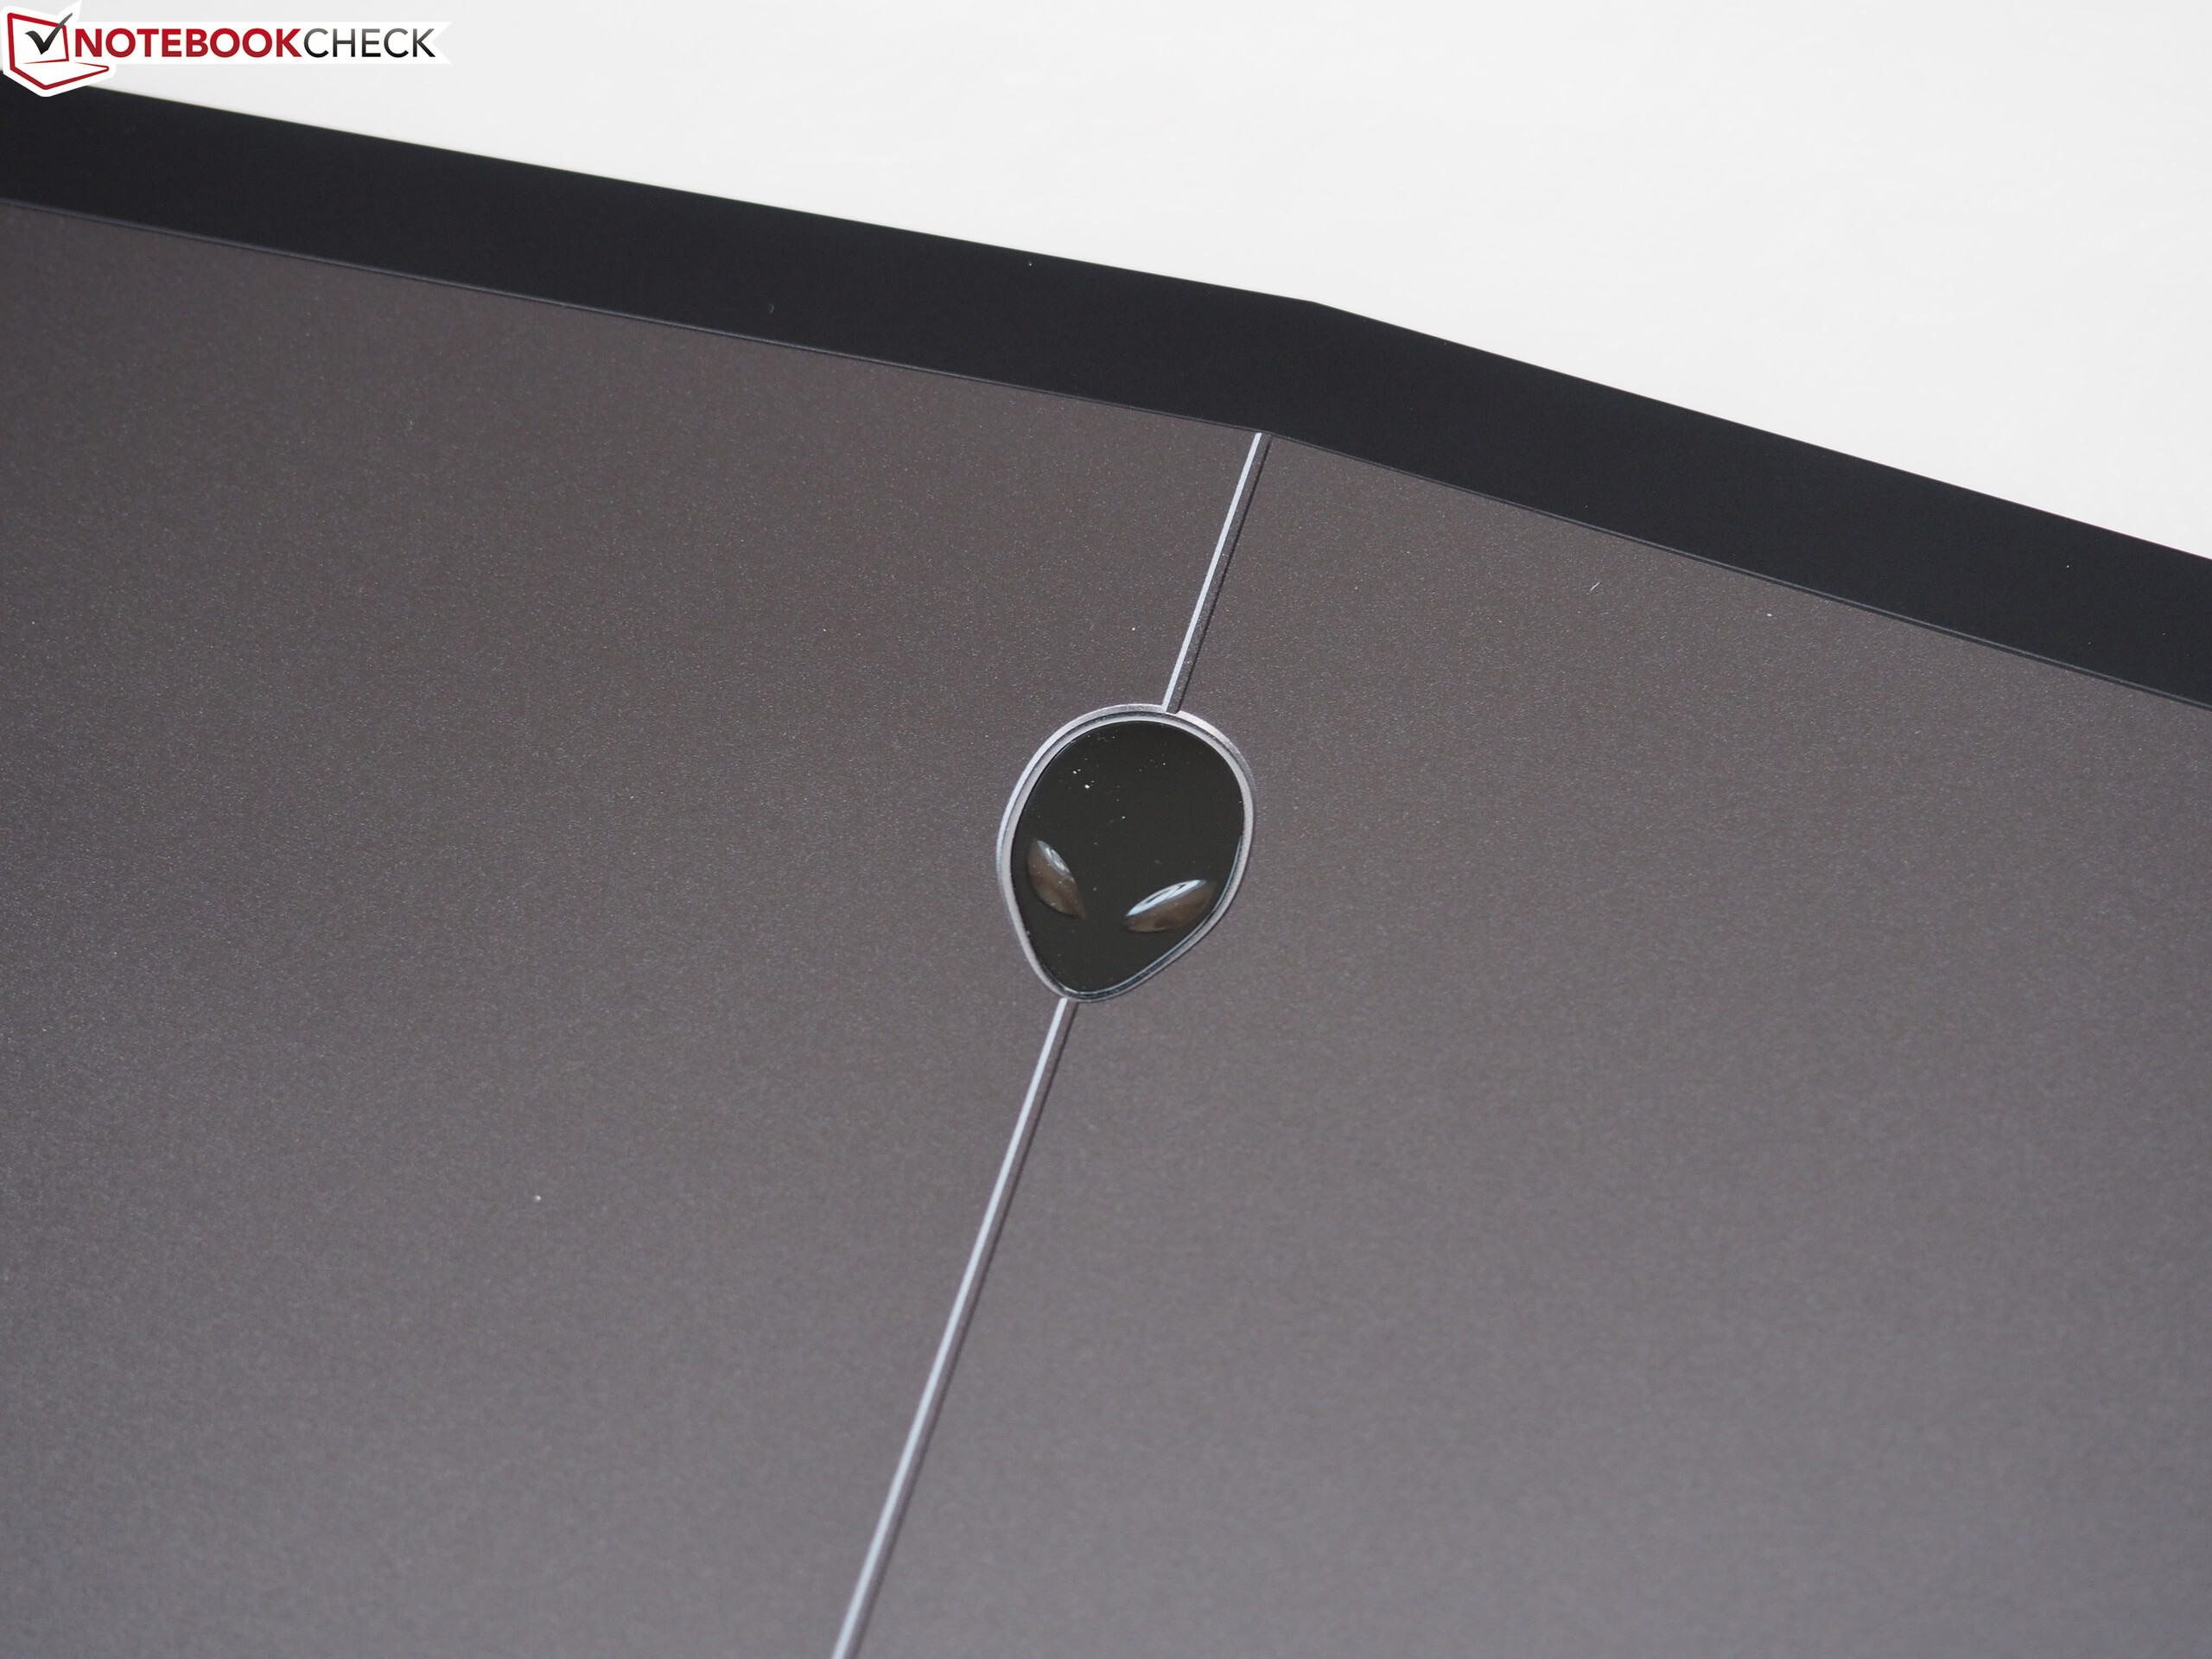
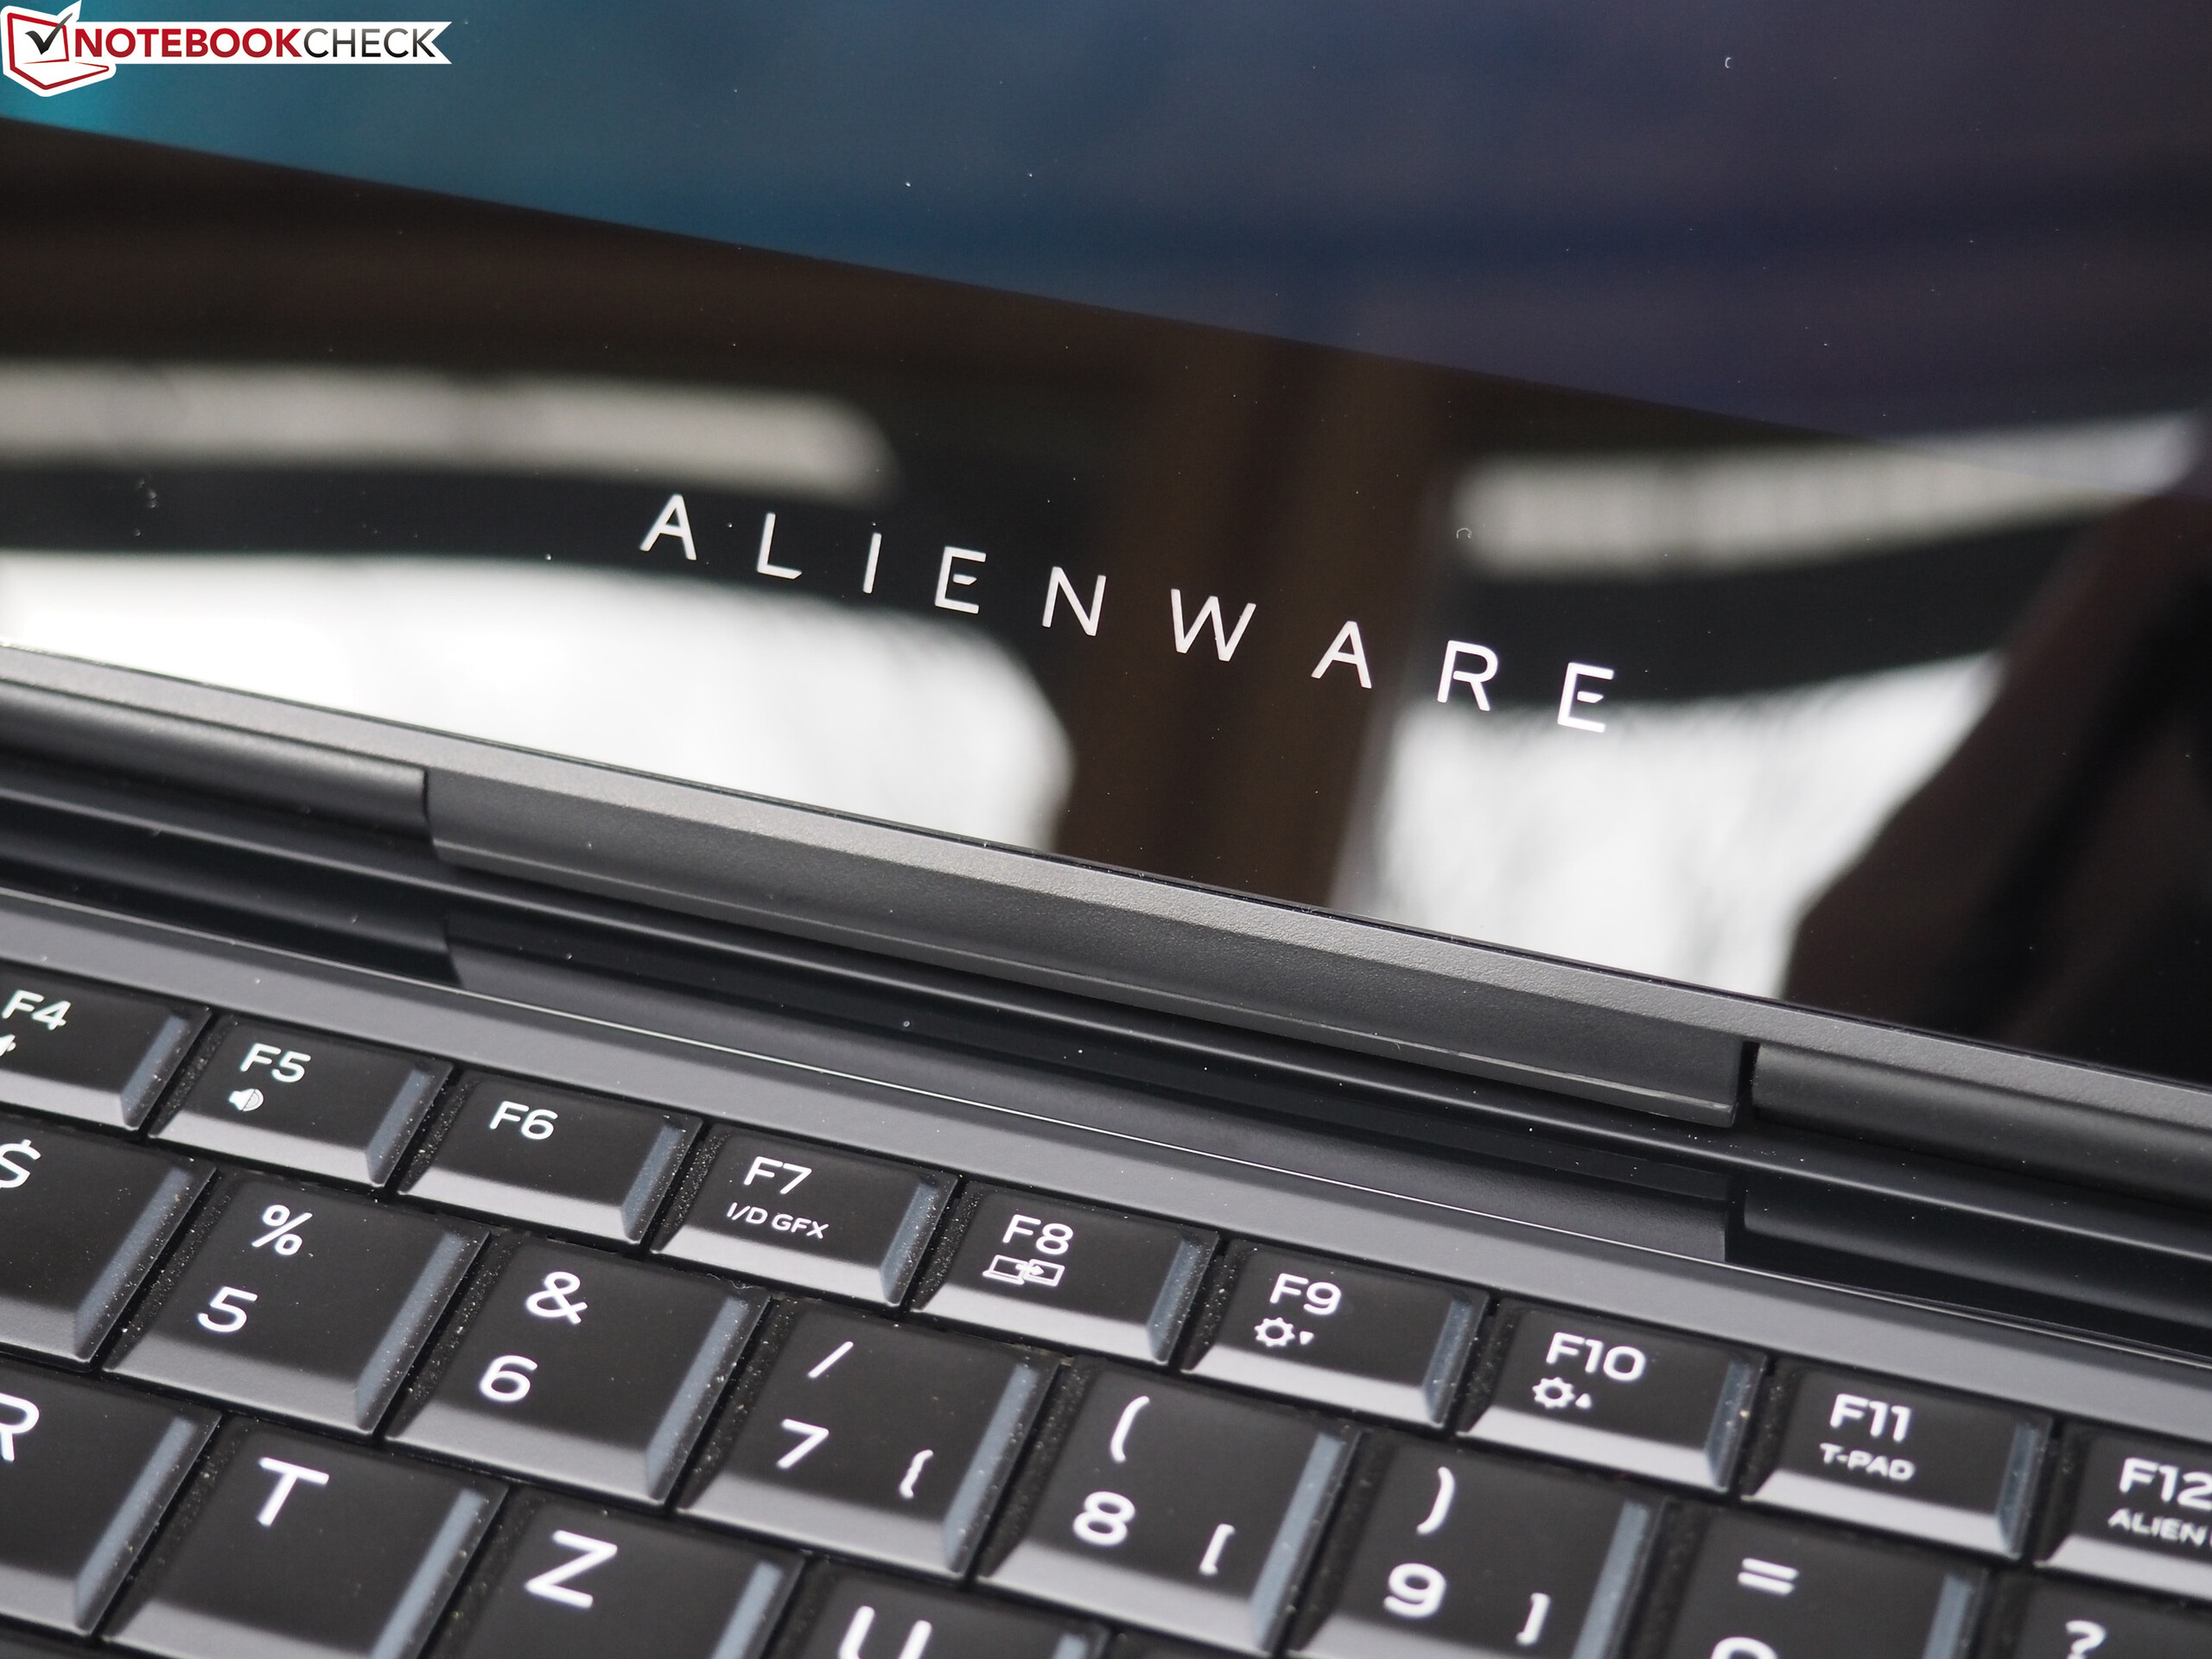
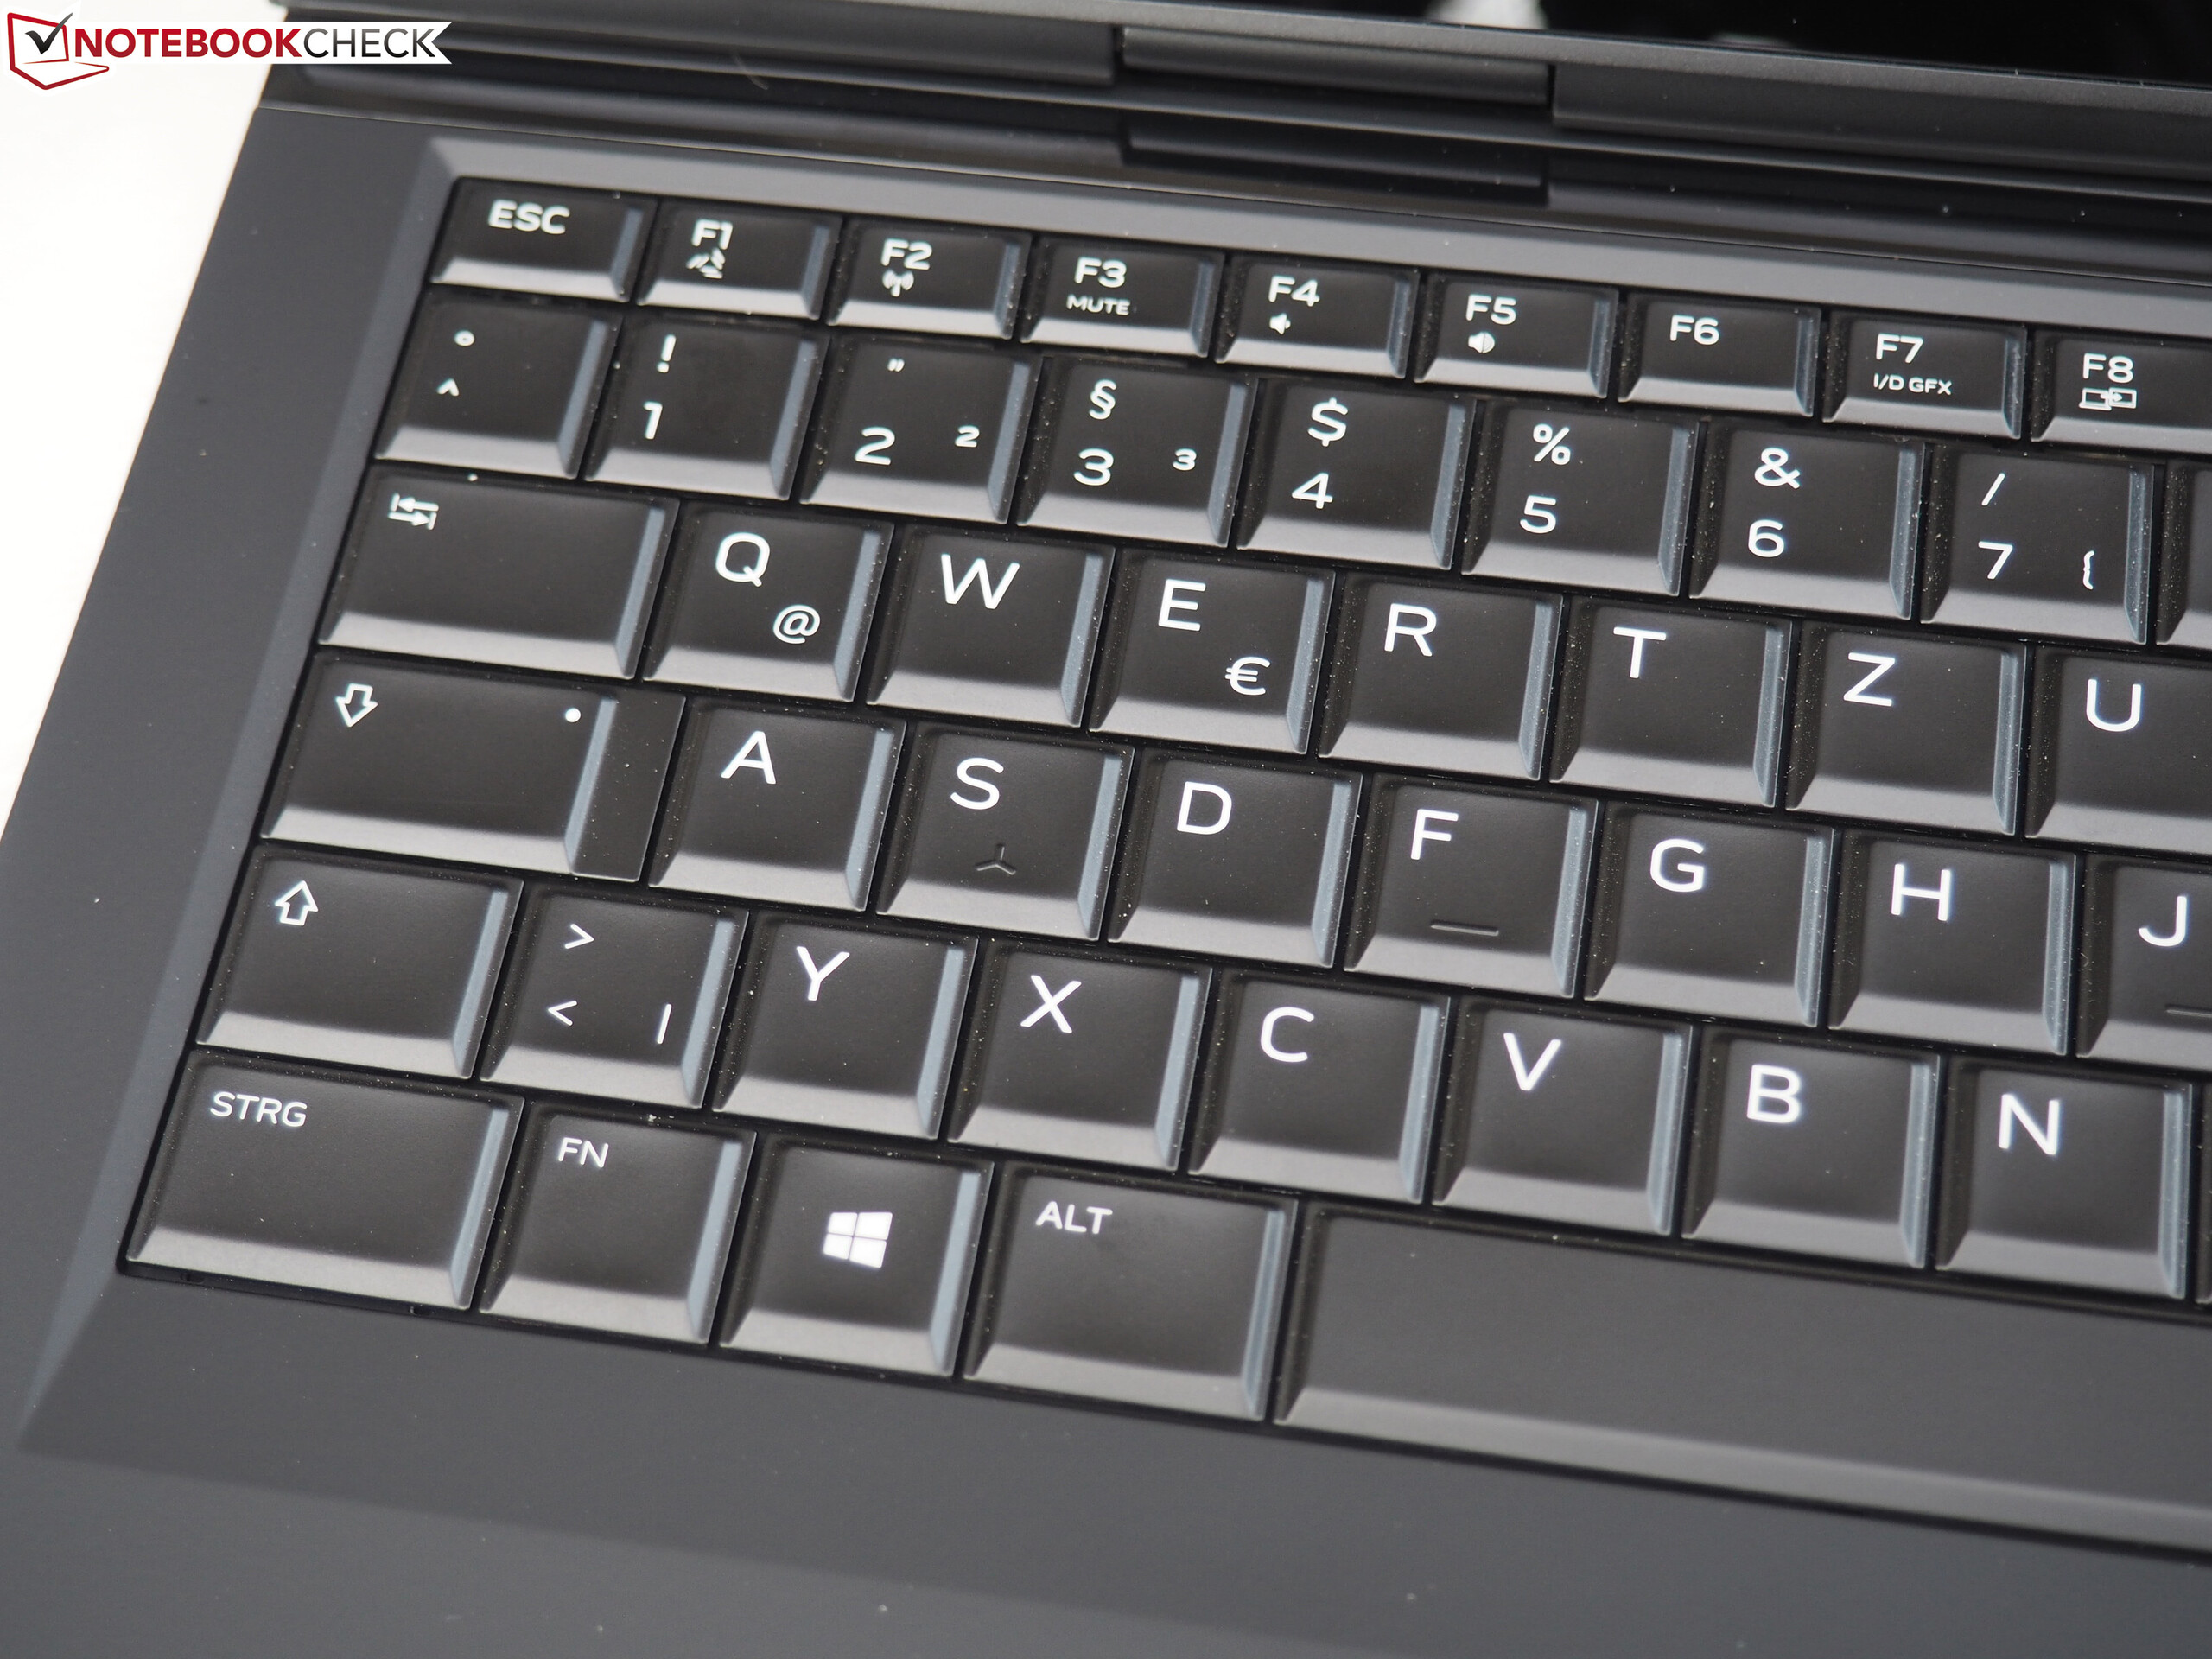
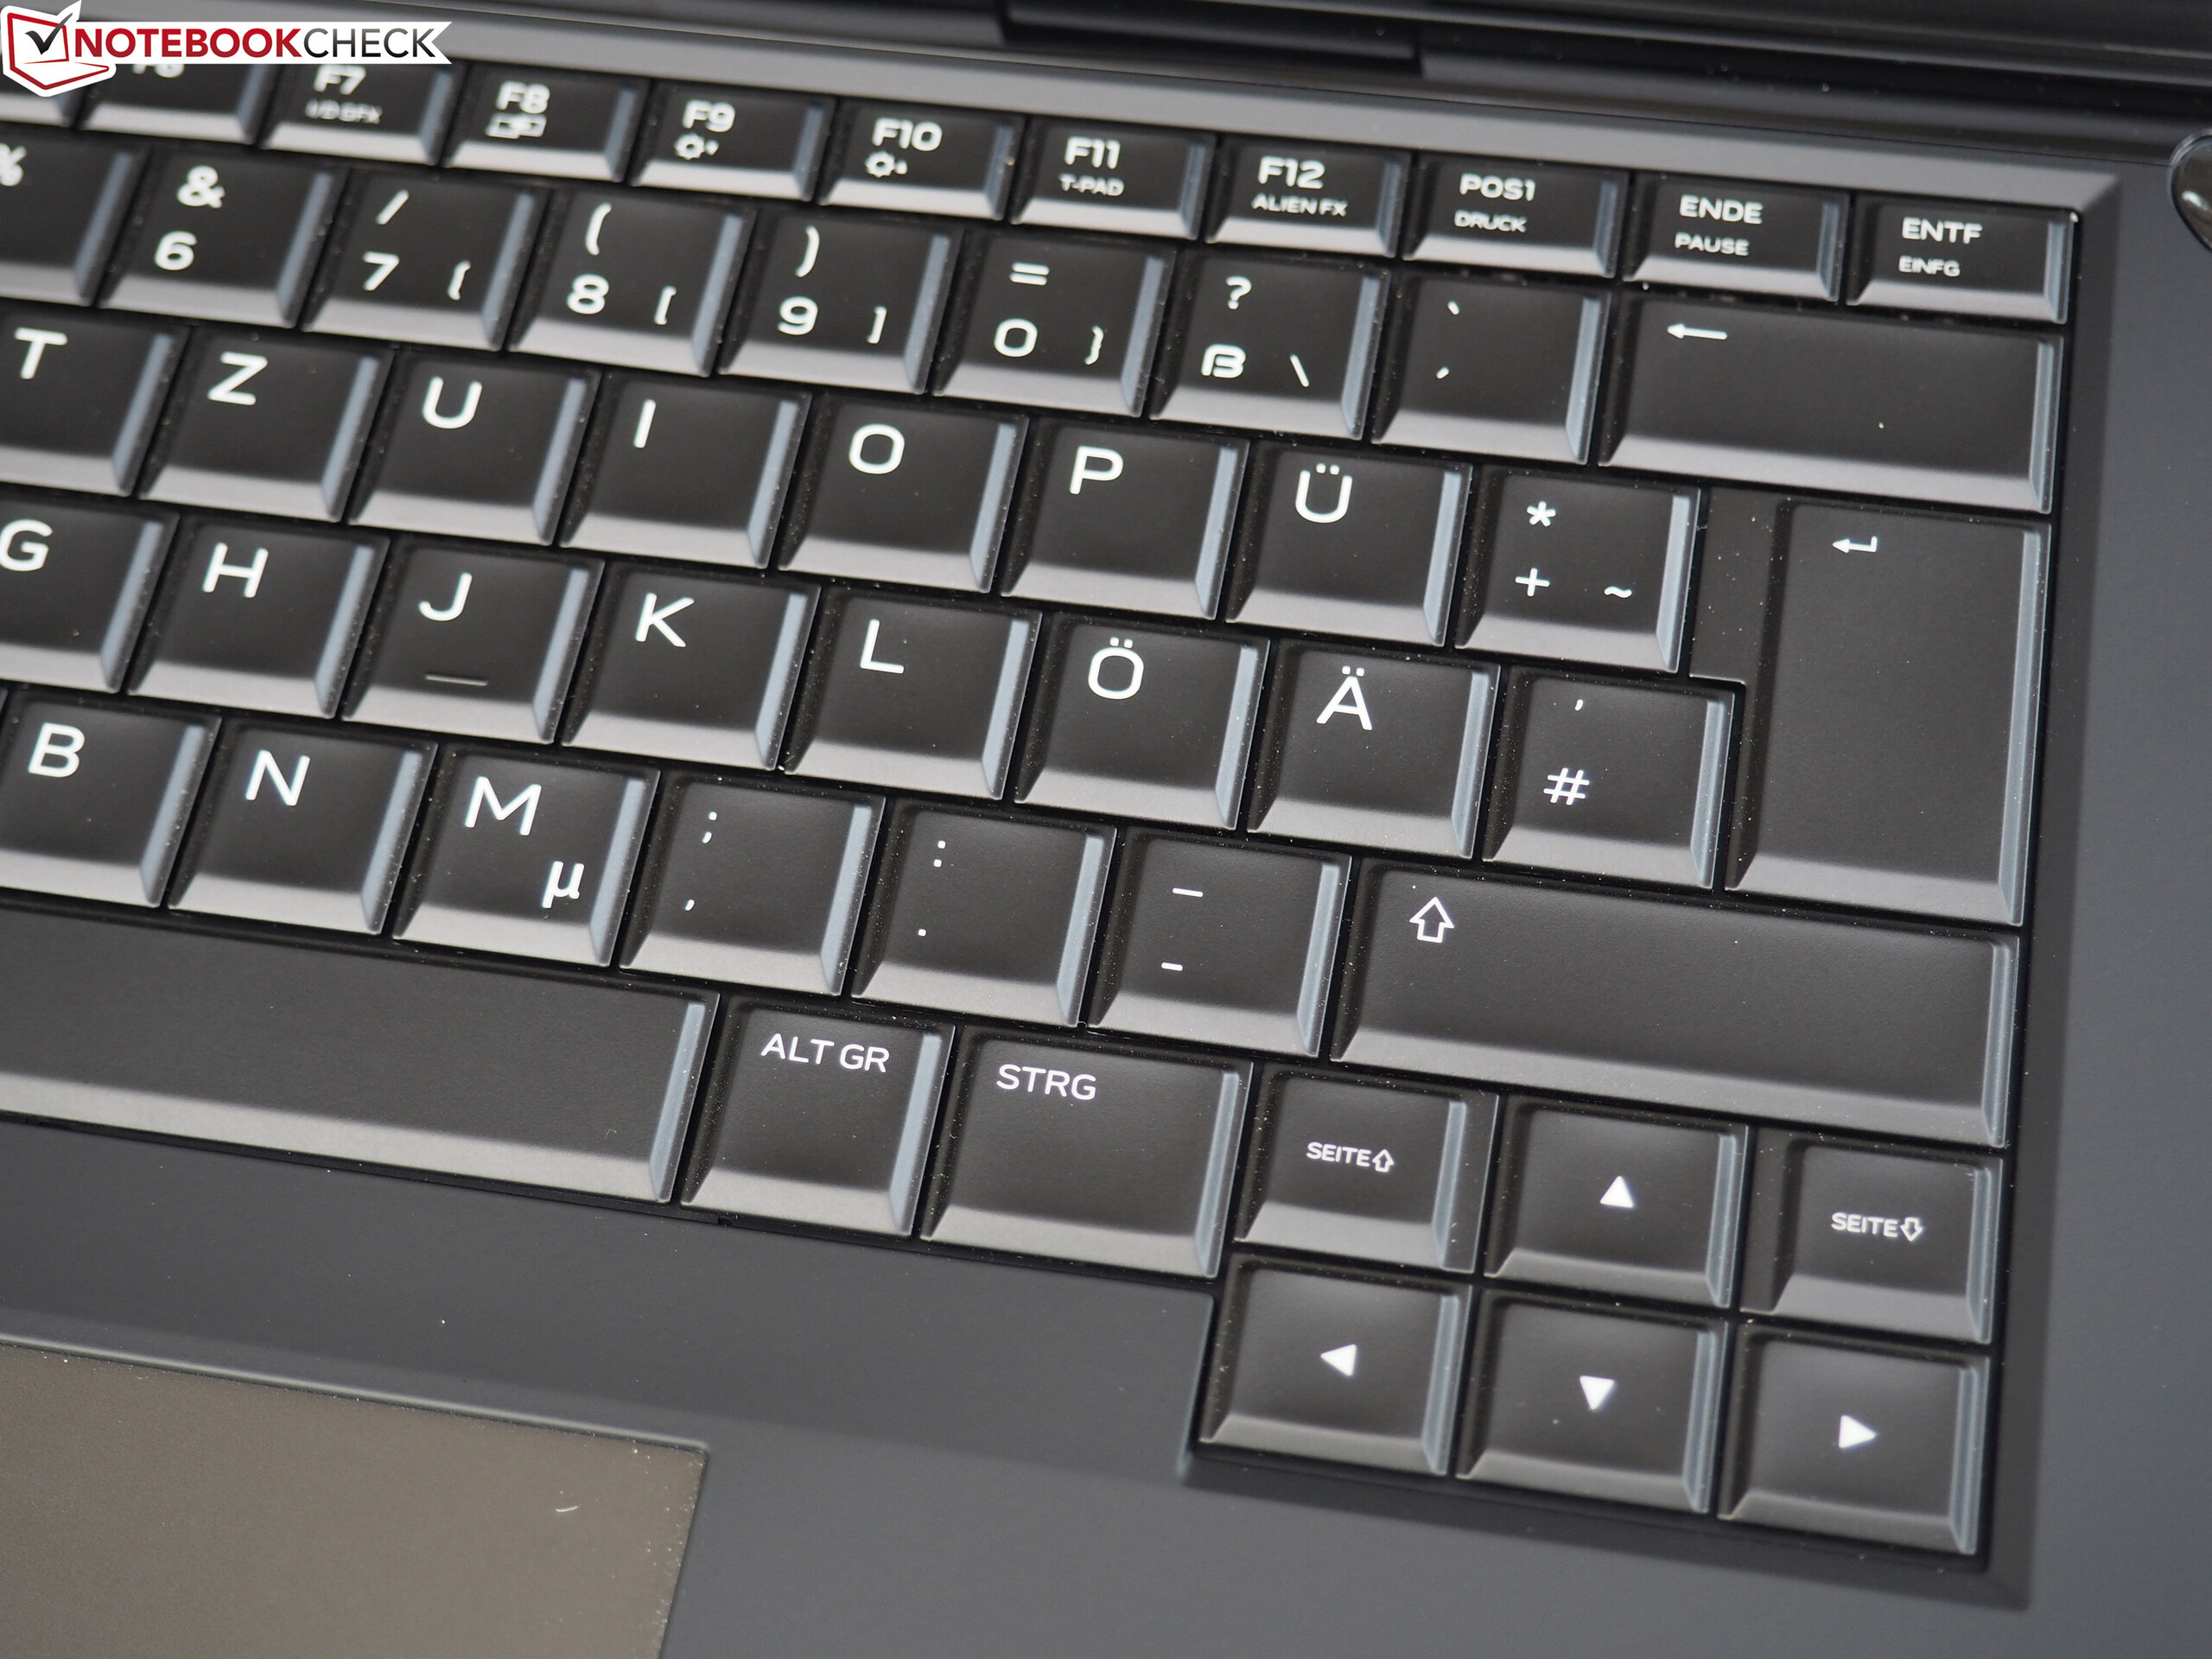
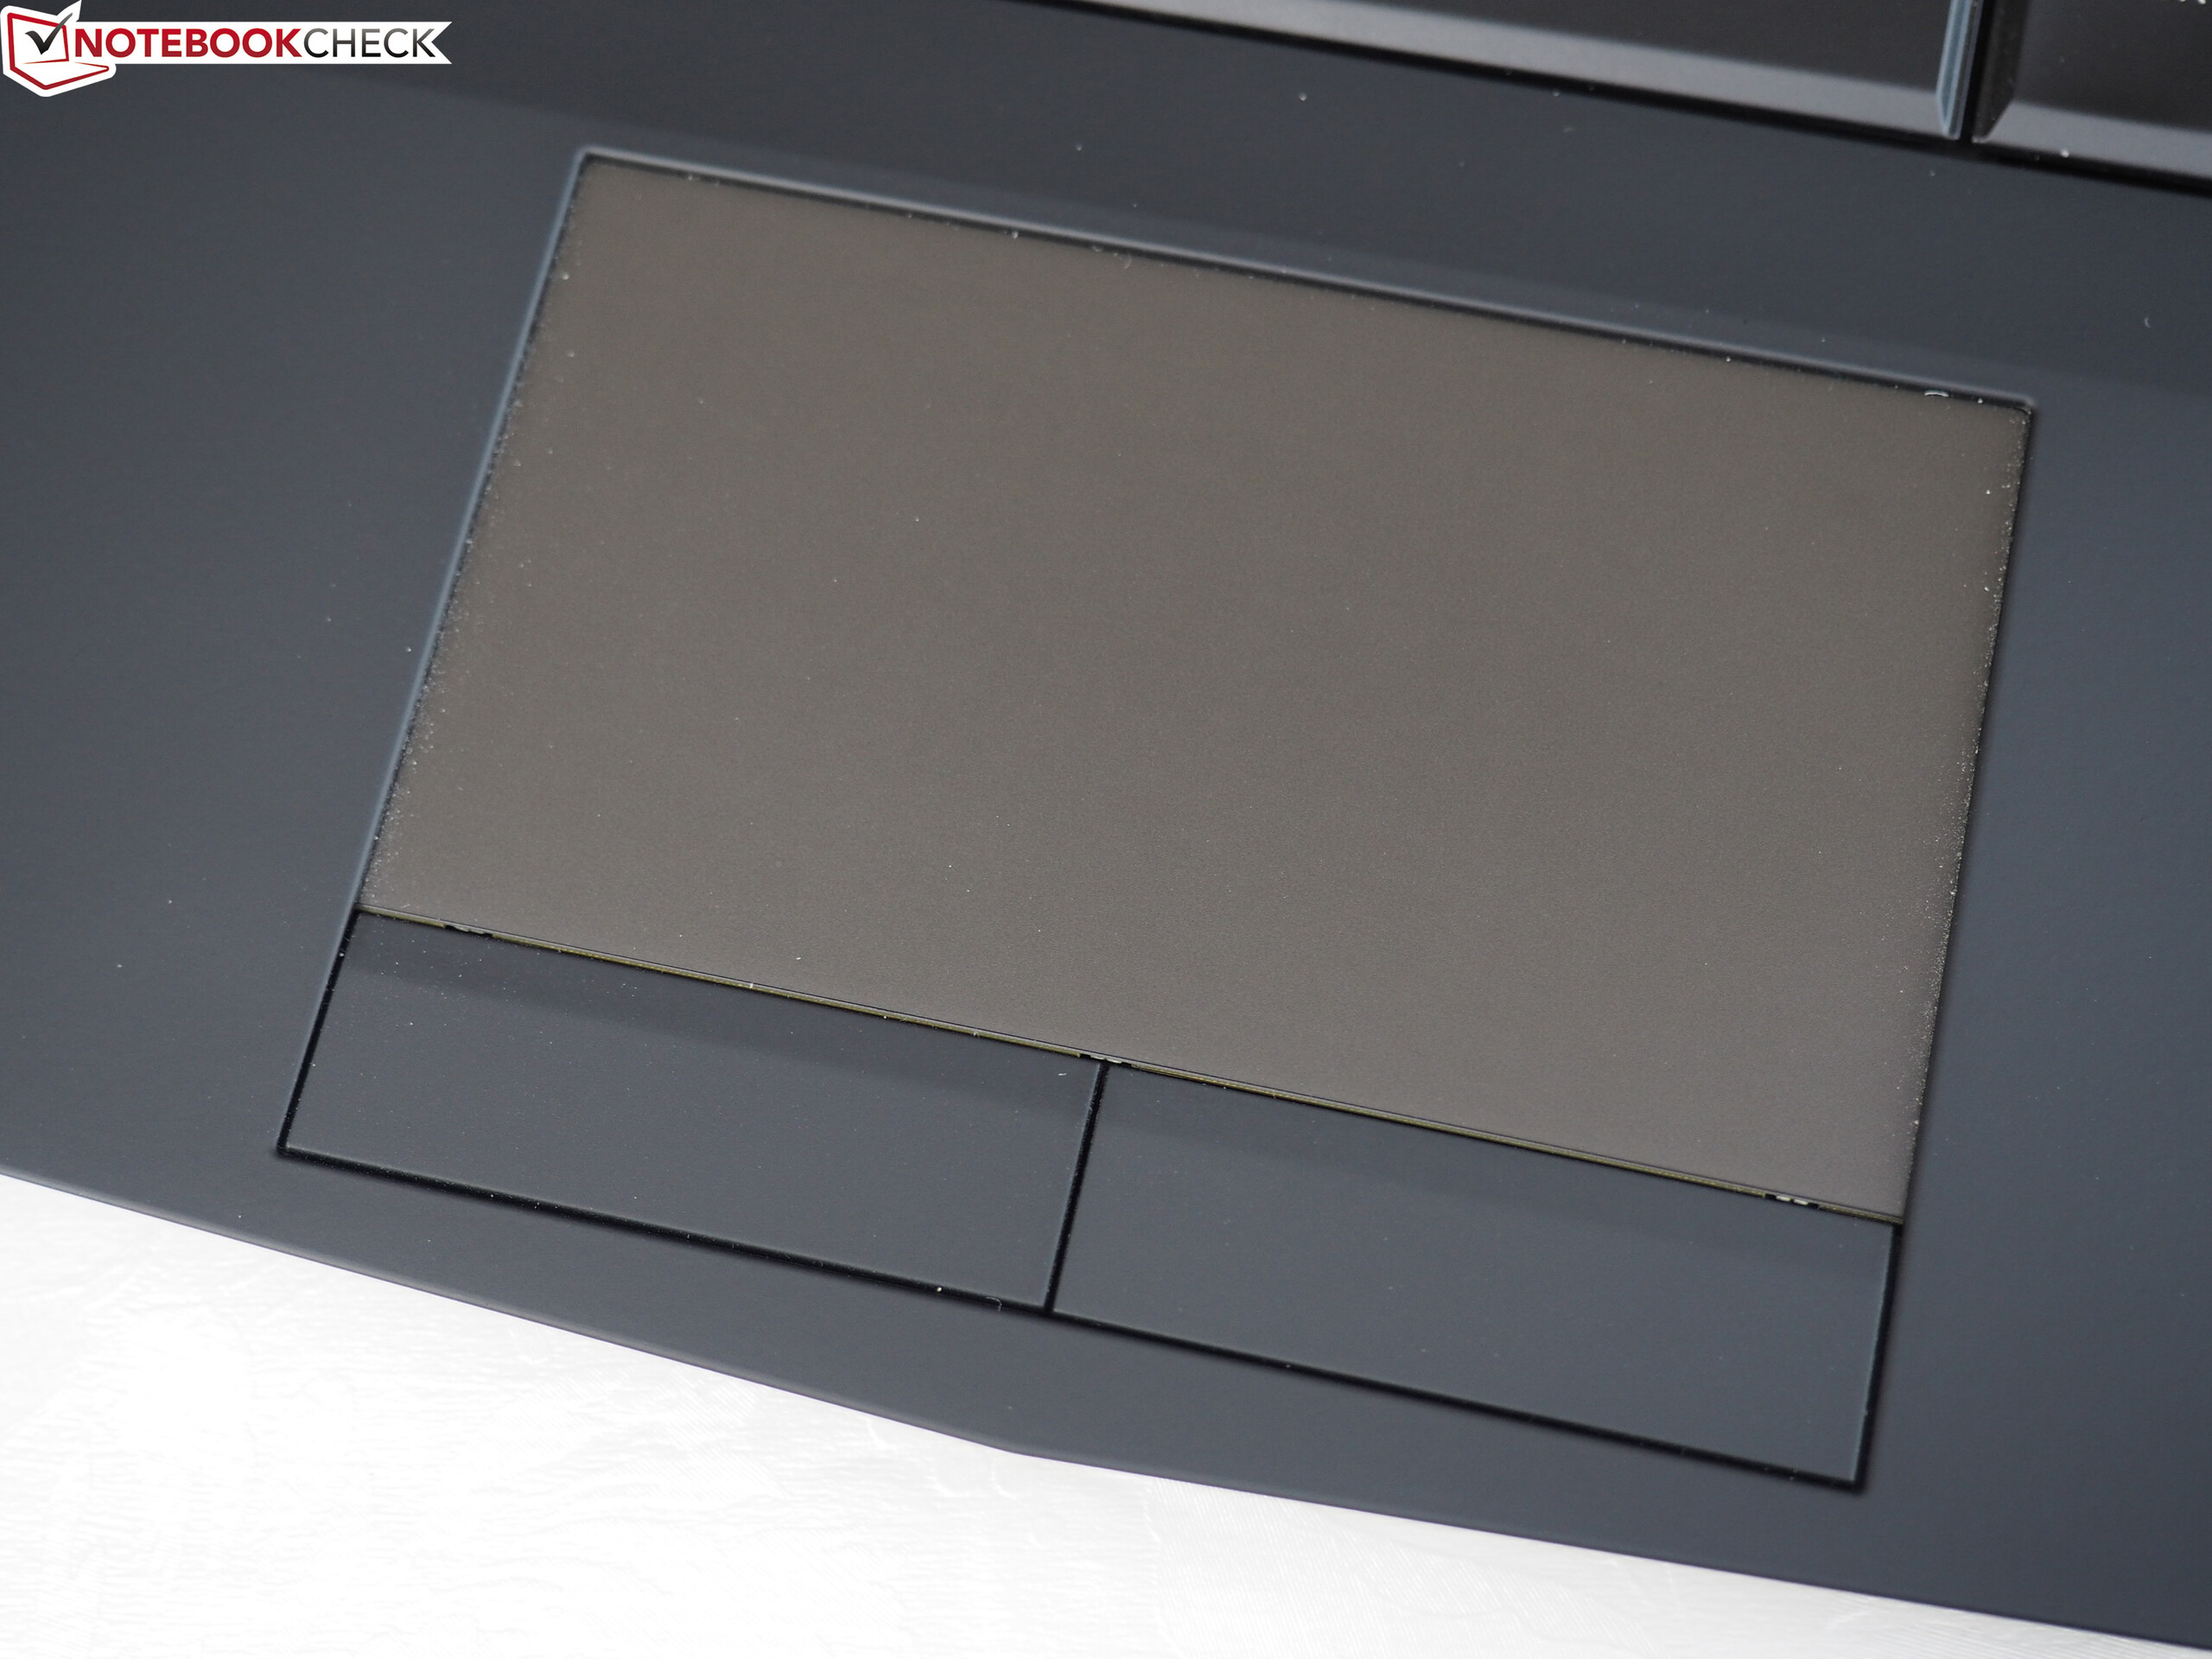
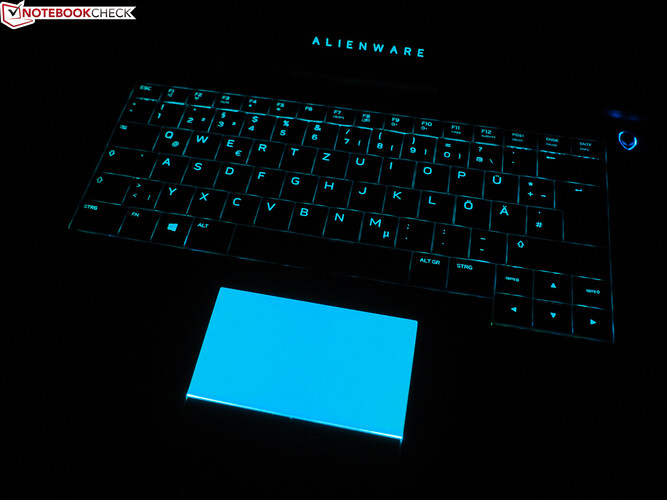
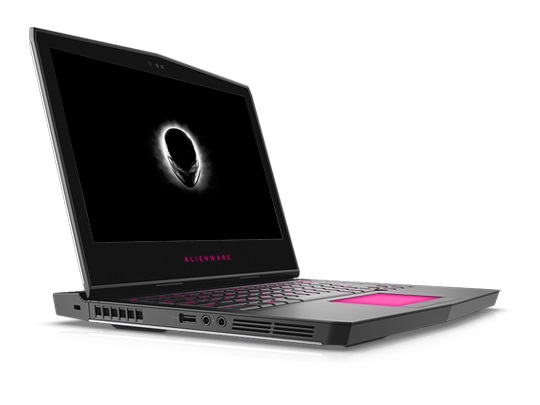
它的机身特别值得赞誉。它延续了Alienware设备一贯的时尚、精致、坚固且做工精良。它提供了不少的背光元素,让它十分易于在黑暗中使用。它的键盘和触控板也可以达到高端设备的水准。不过,它的高配机型采用的QHD的OLED屏幕(2560x1440像素)才是真正的亮点。不管是可视角度范围,色彩,黑值,对比度还是响应速度,它在各个方面都远胜常见的TN和IPS屏幕面板。不过,你需要注意的是它采用了支持触控的镜面屏幕,这会带来很强的反射。
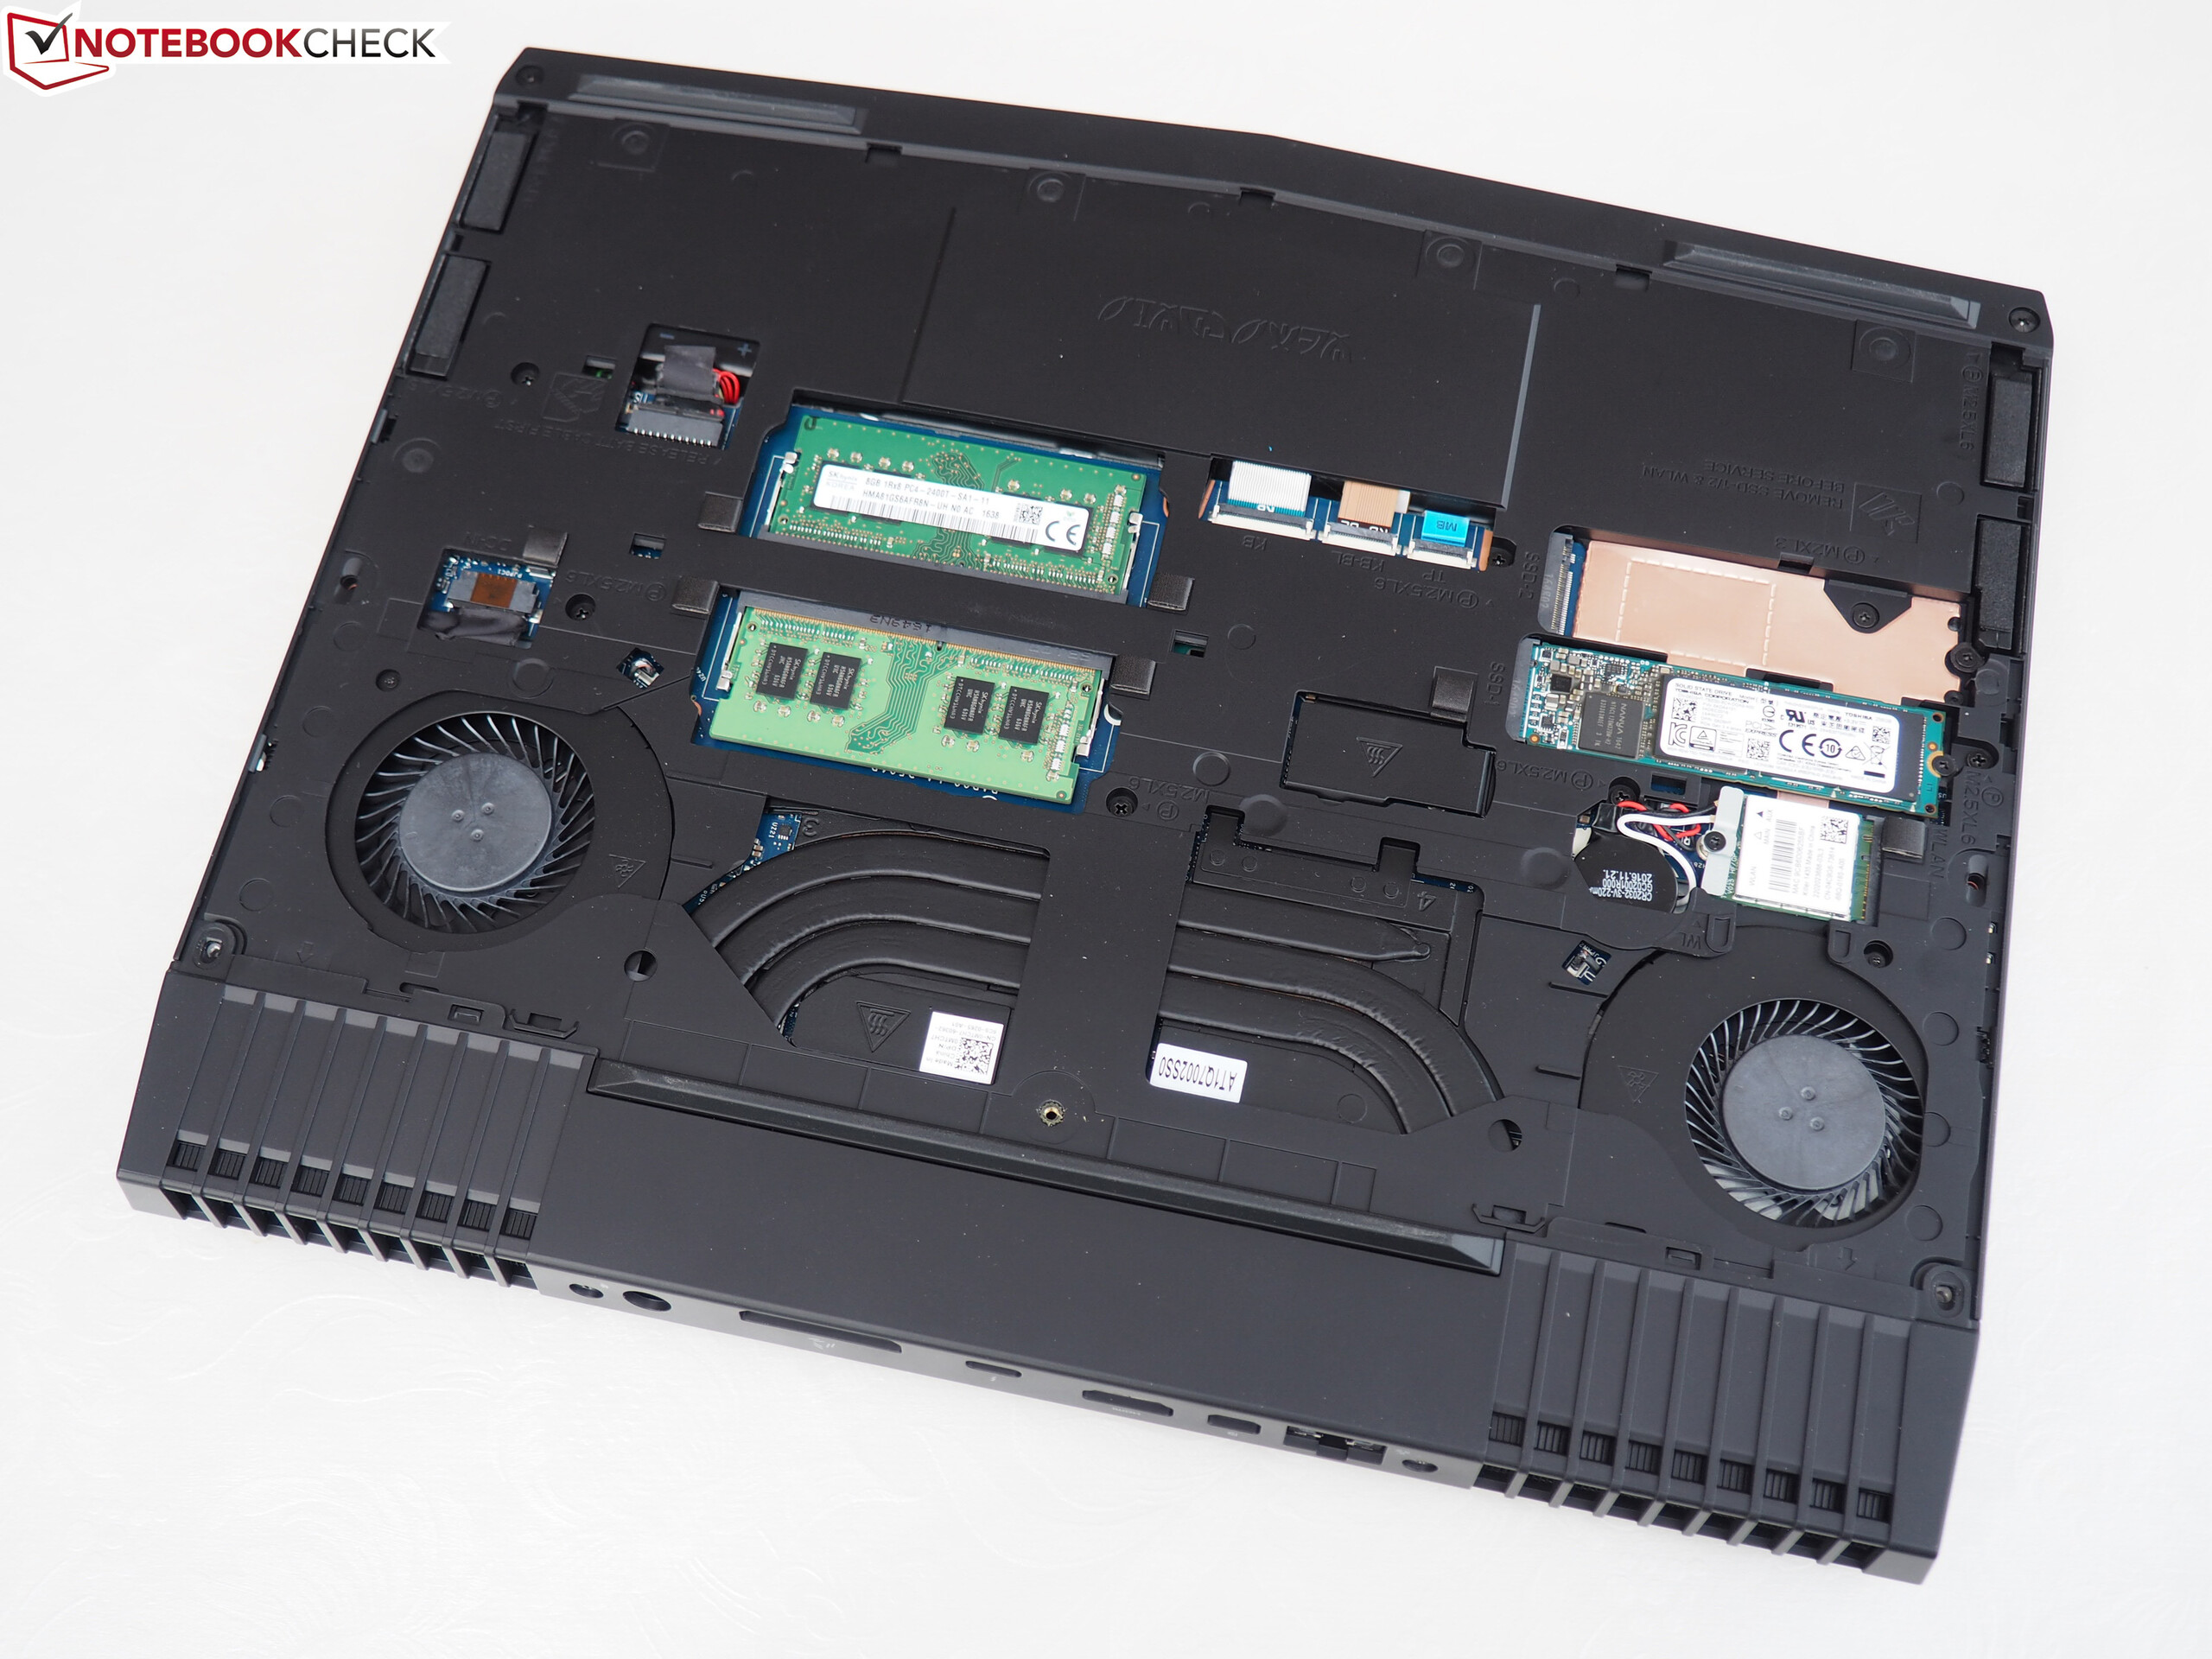
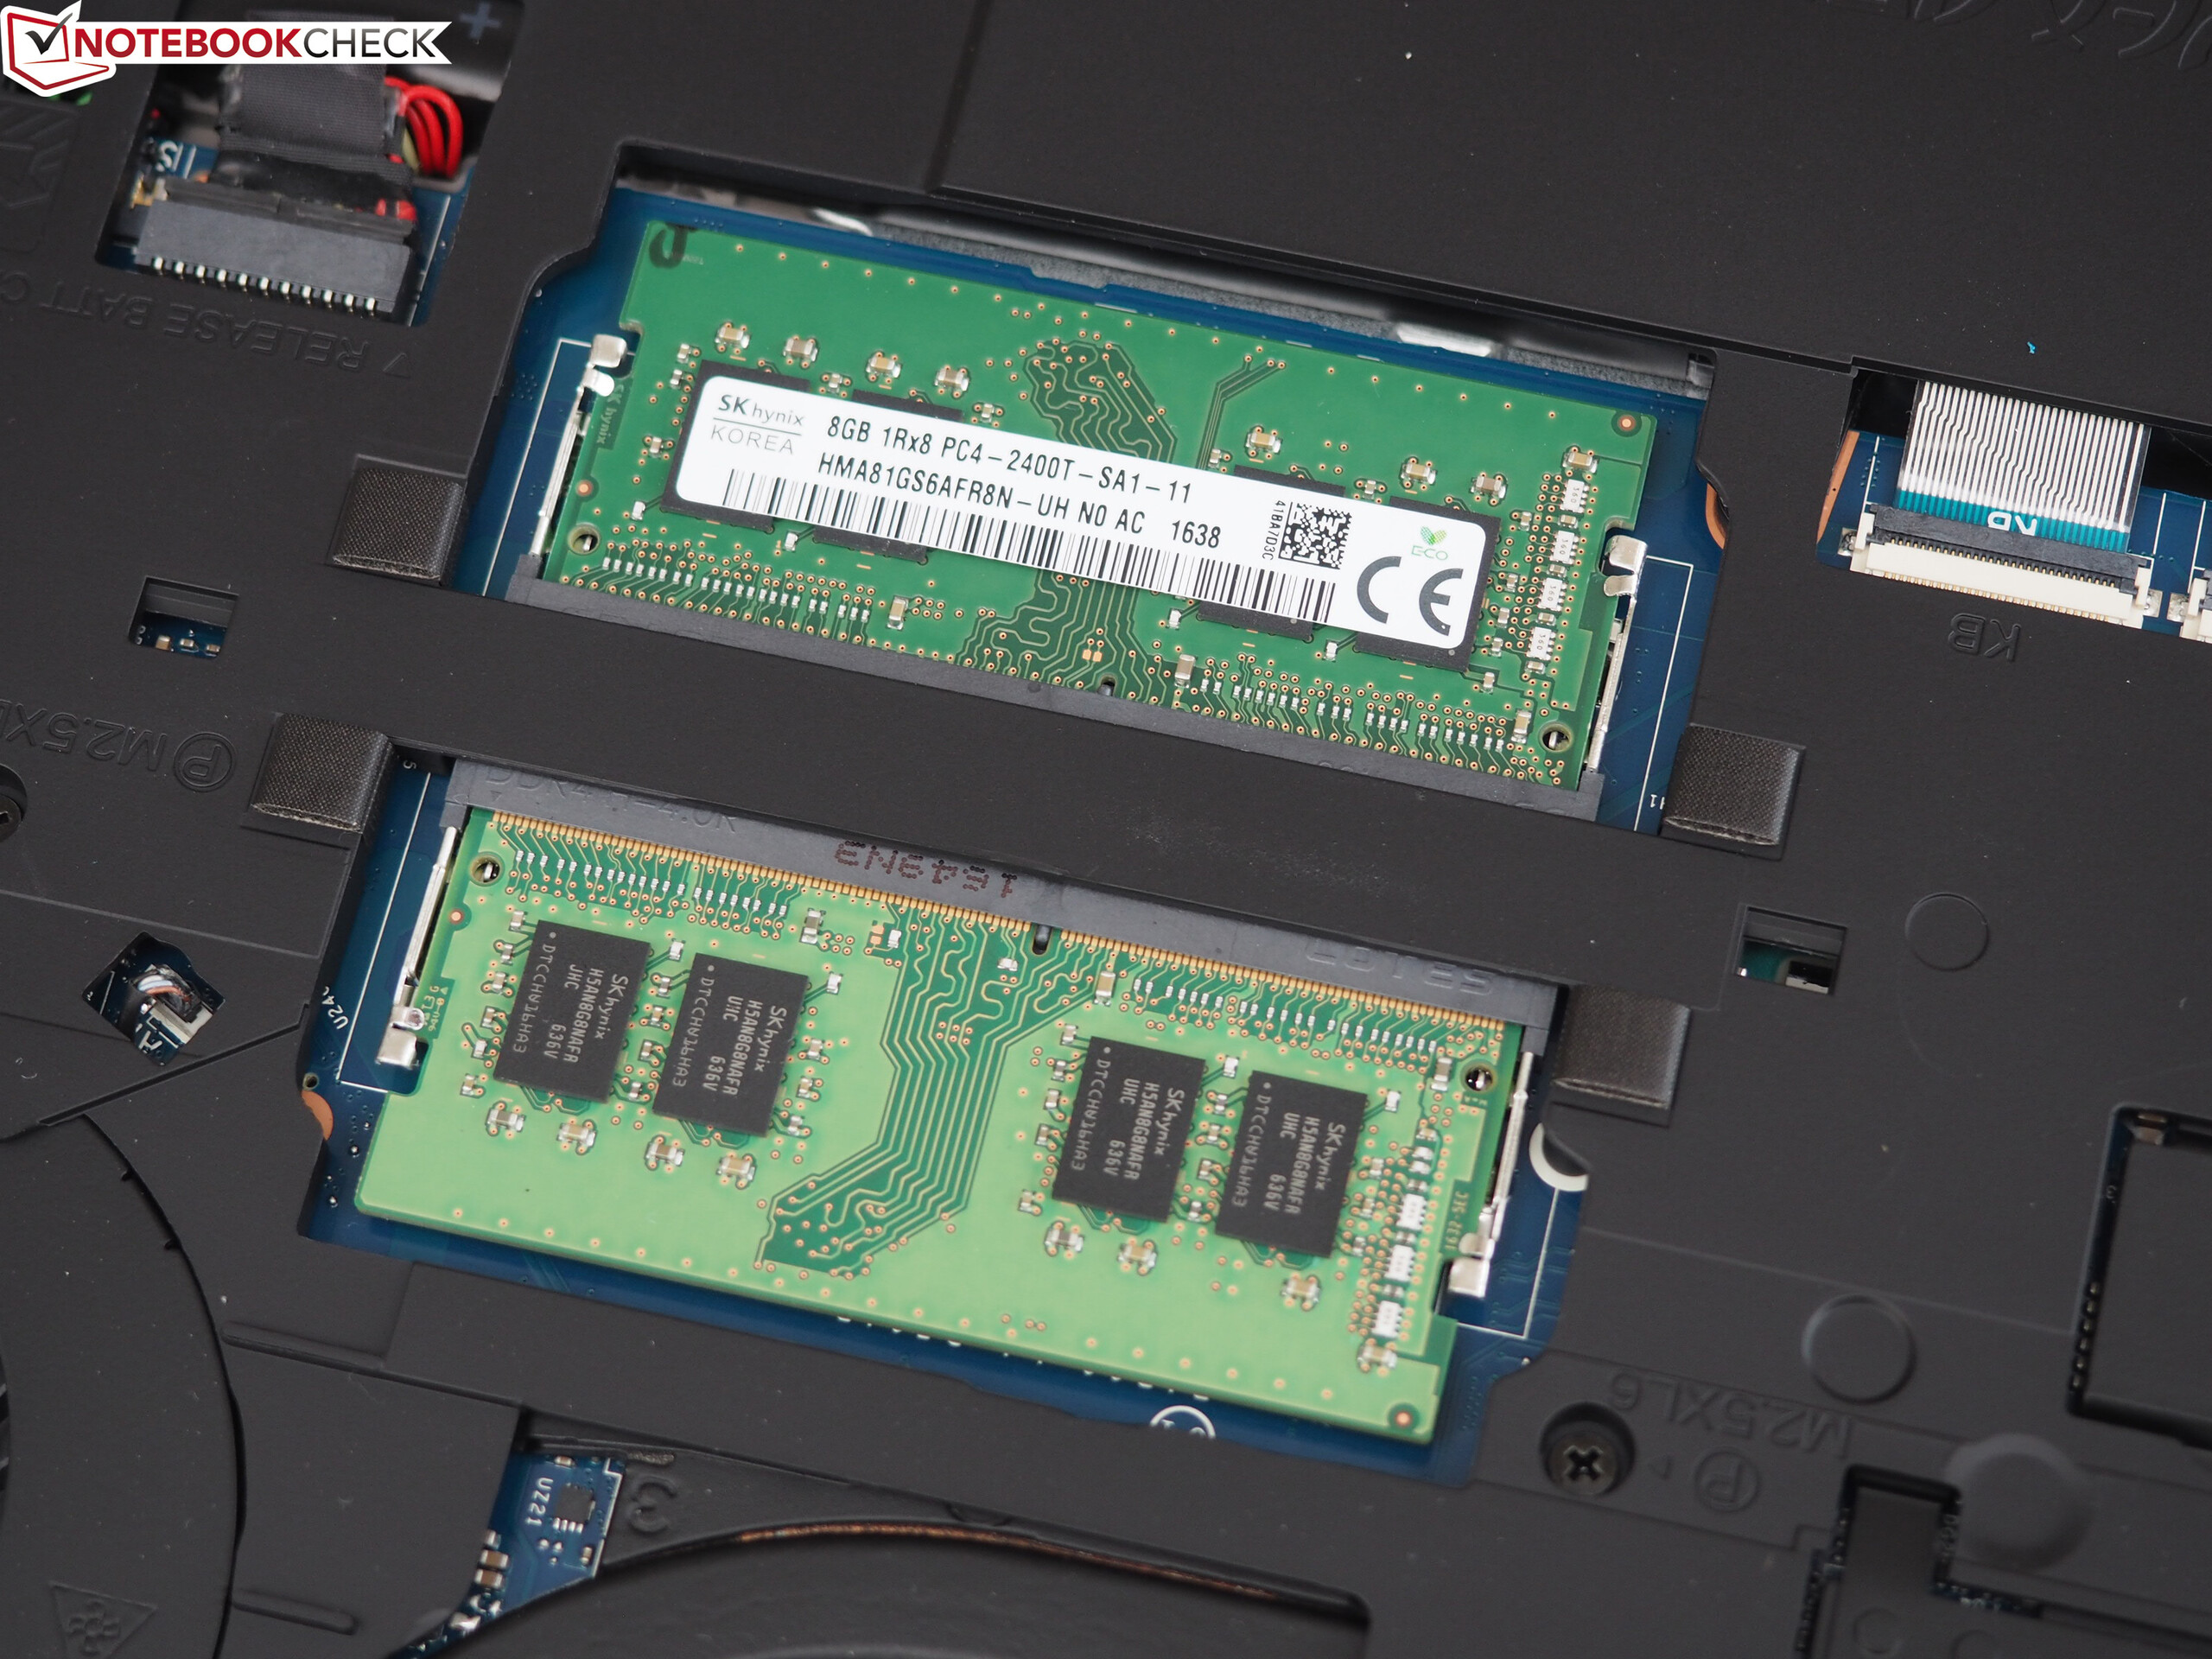
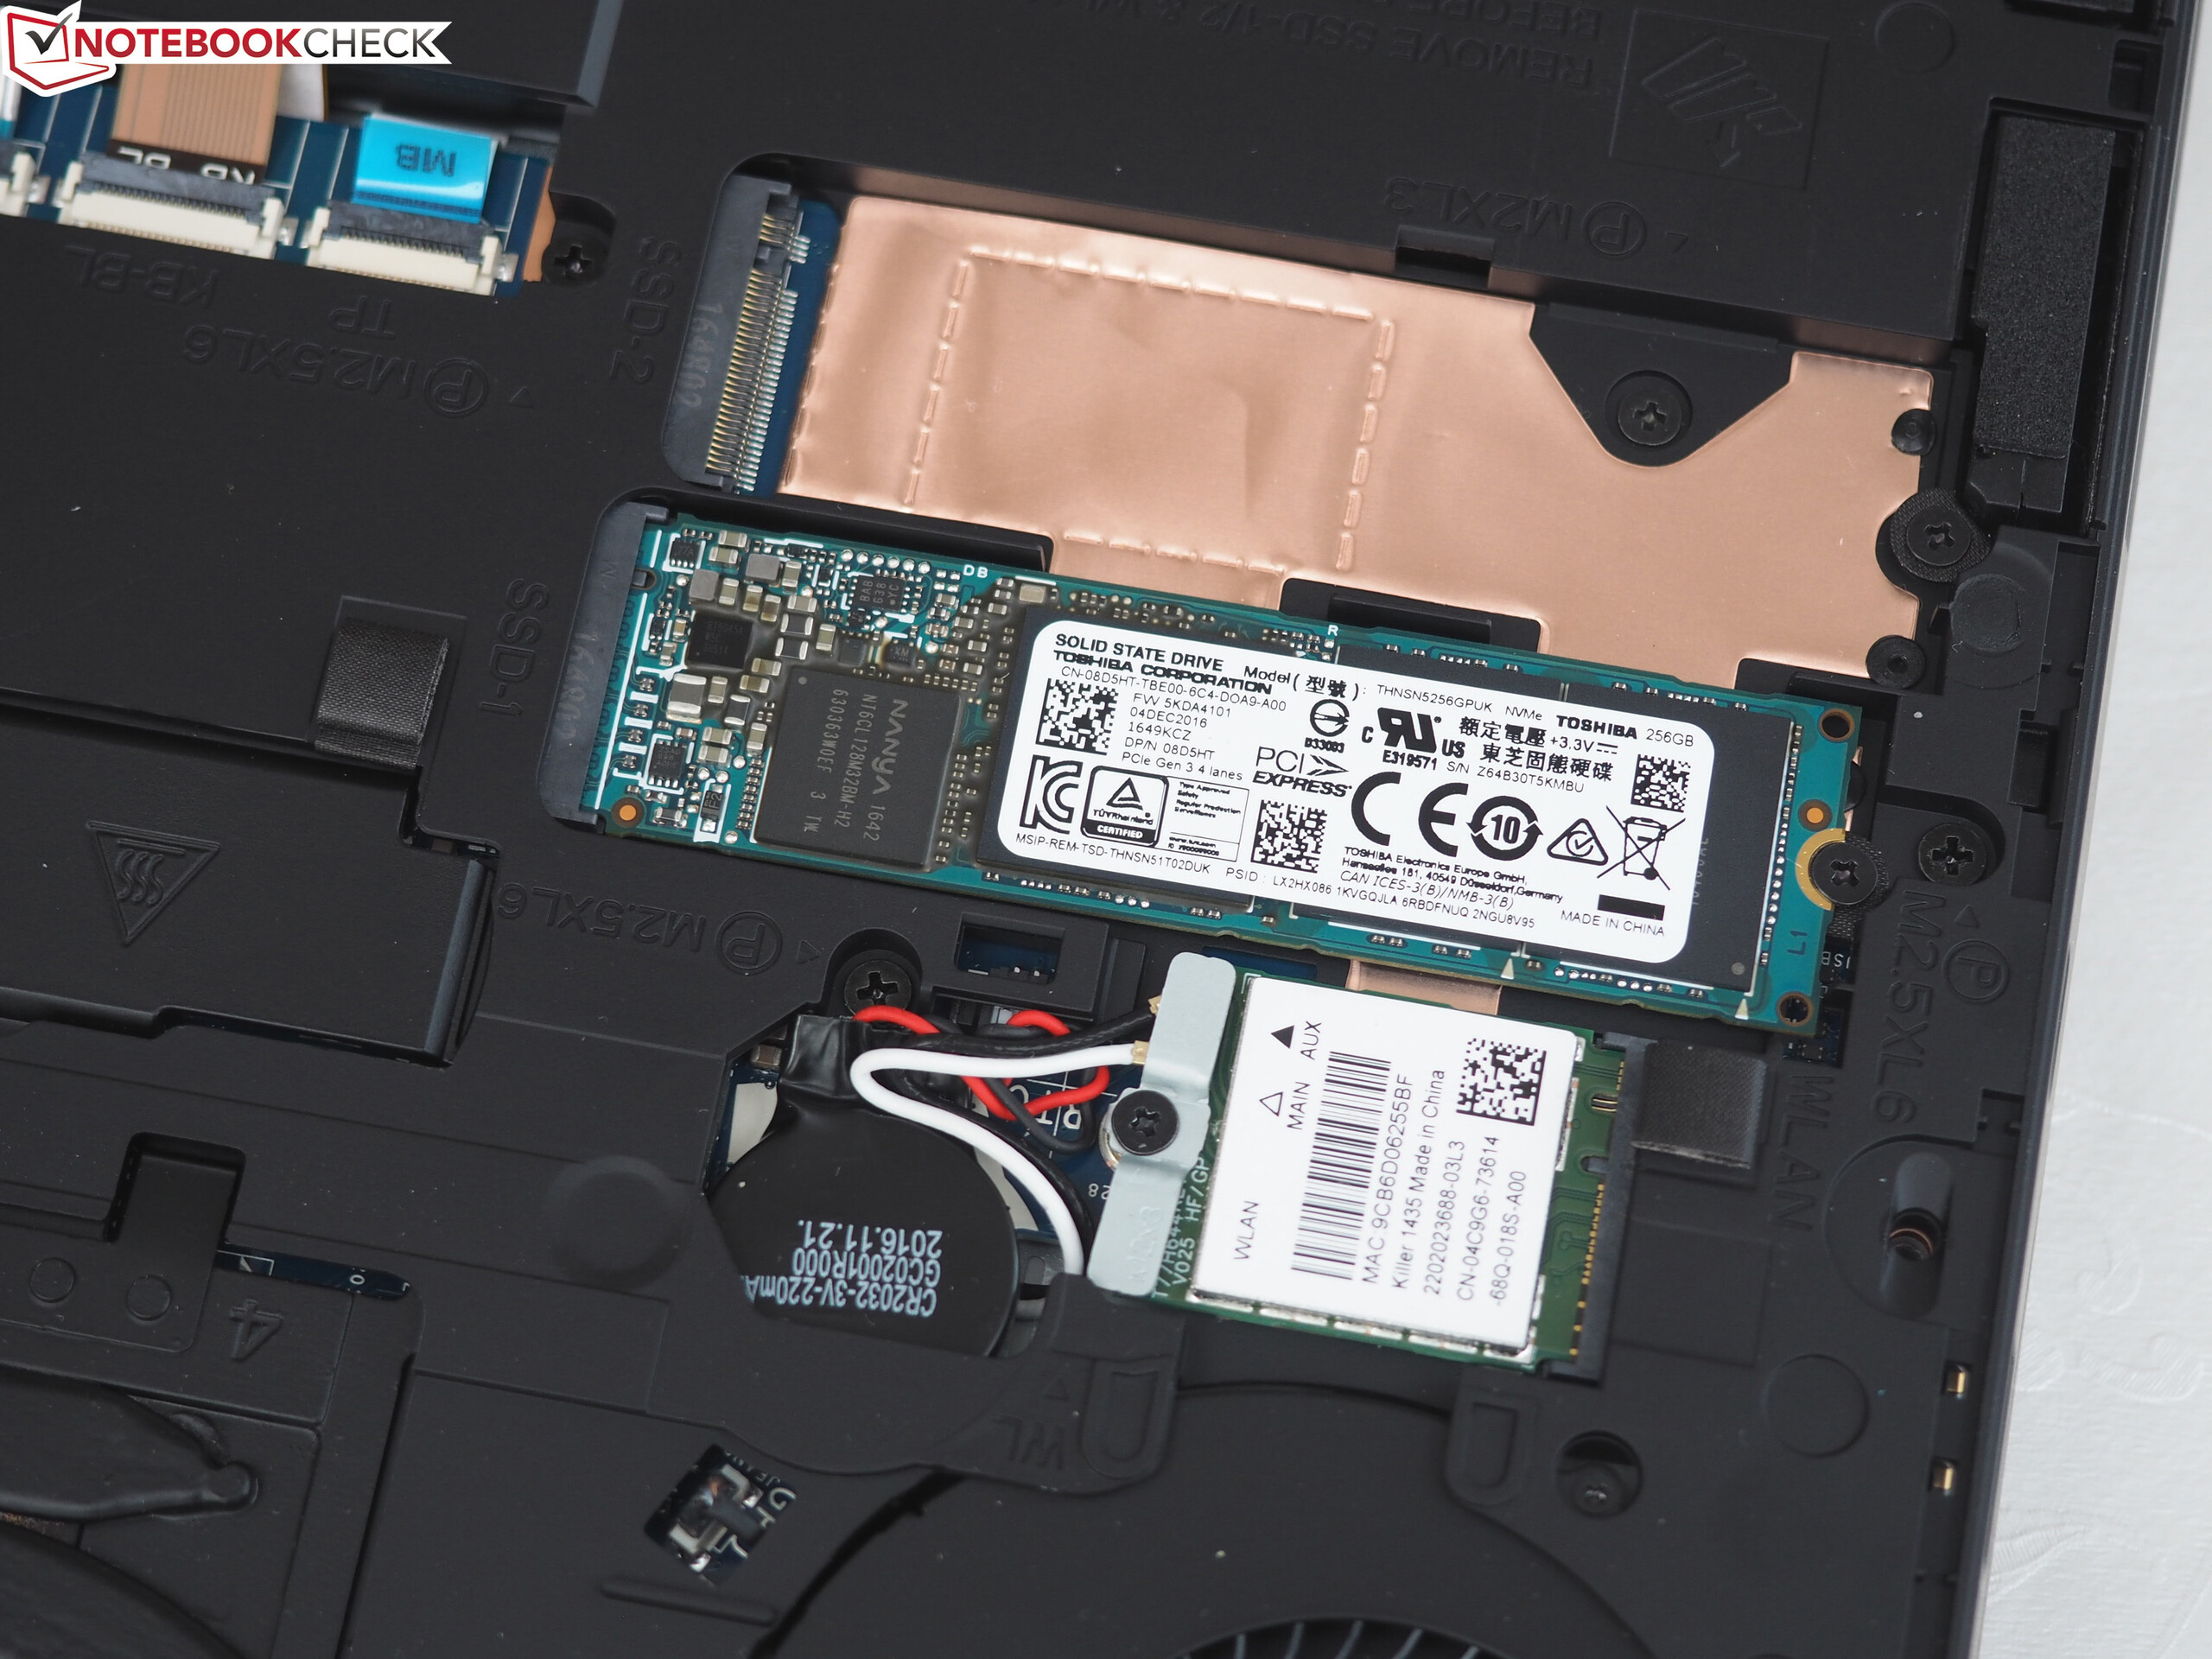
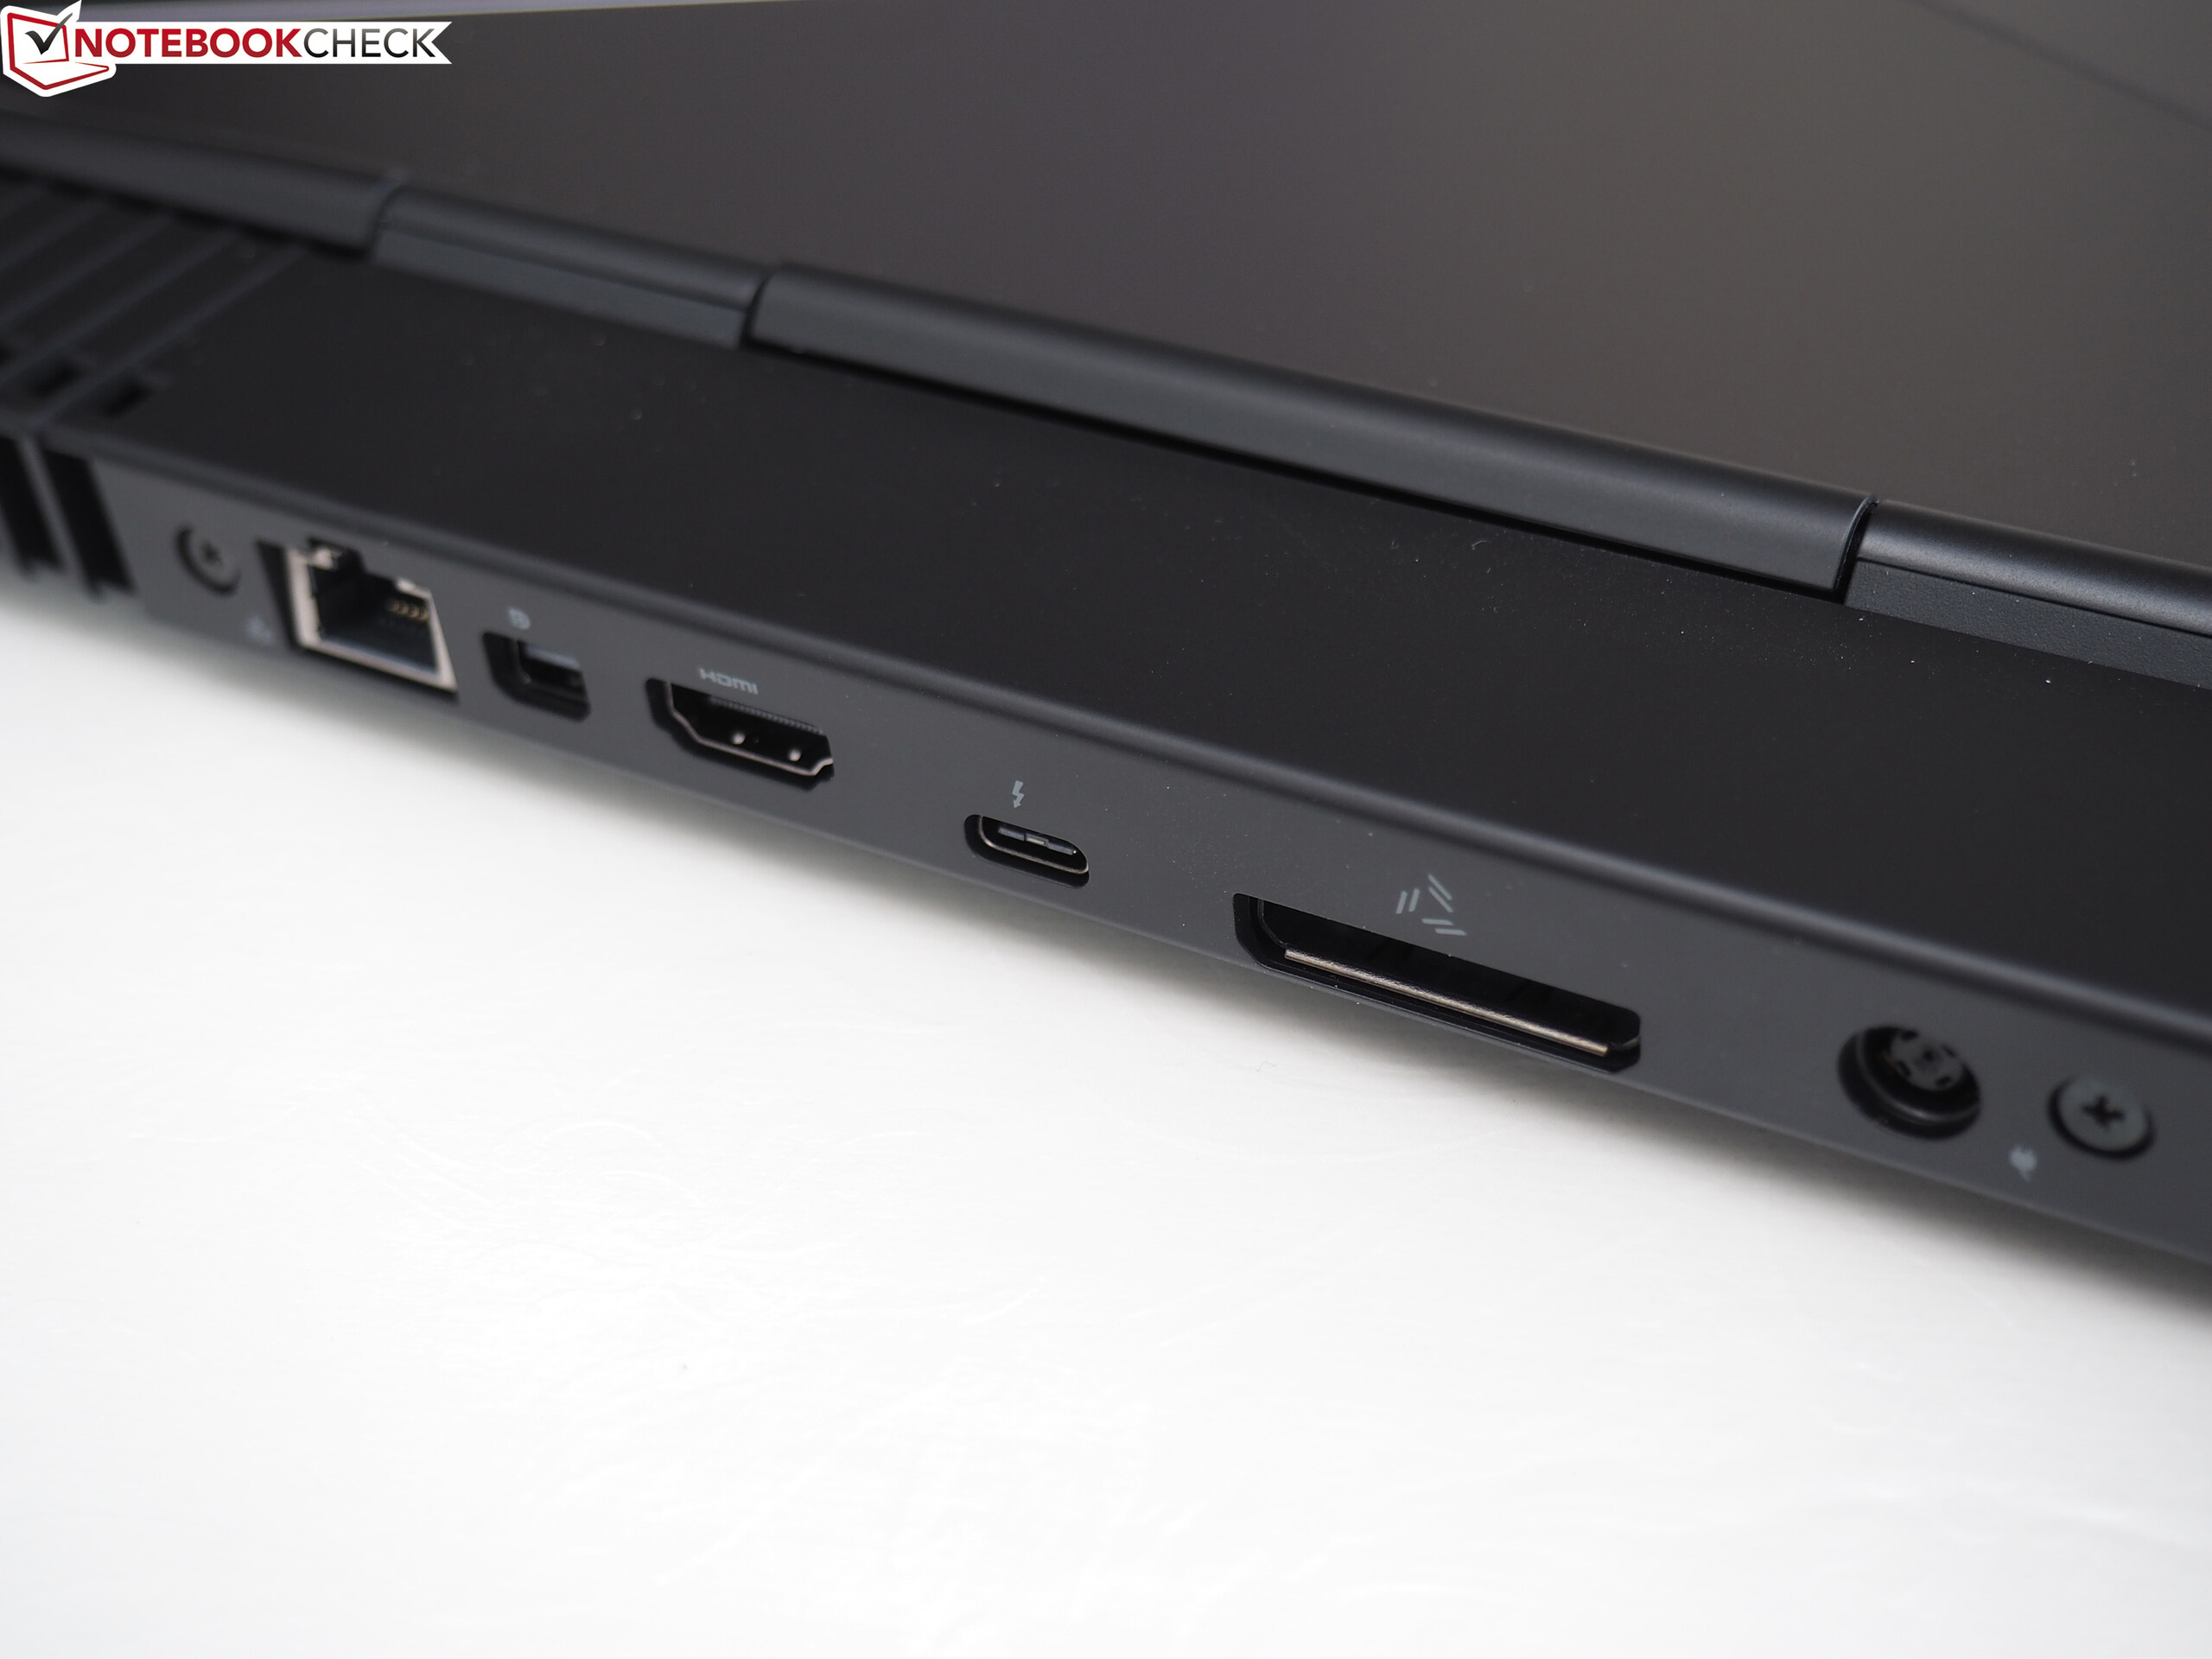
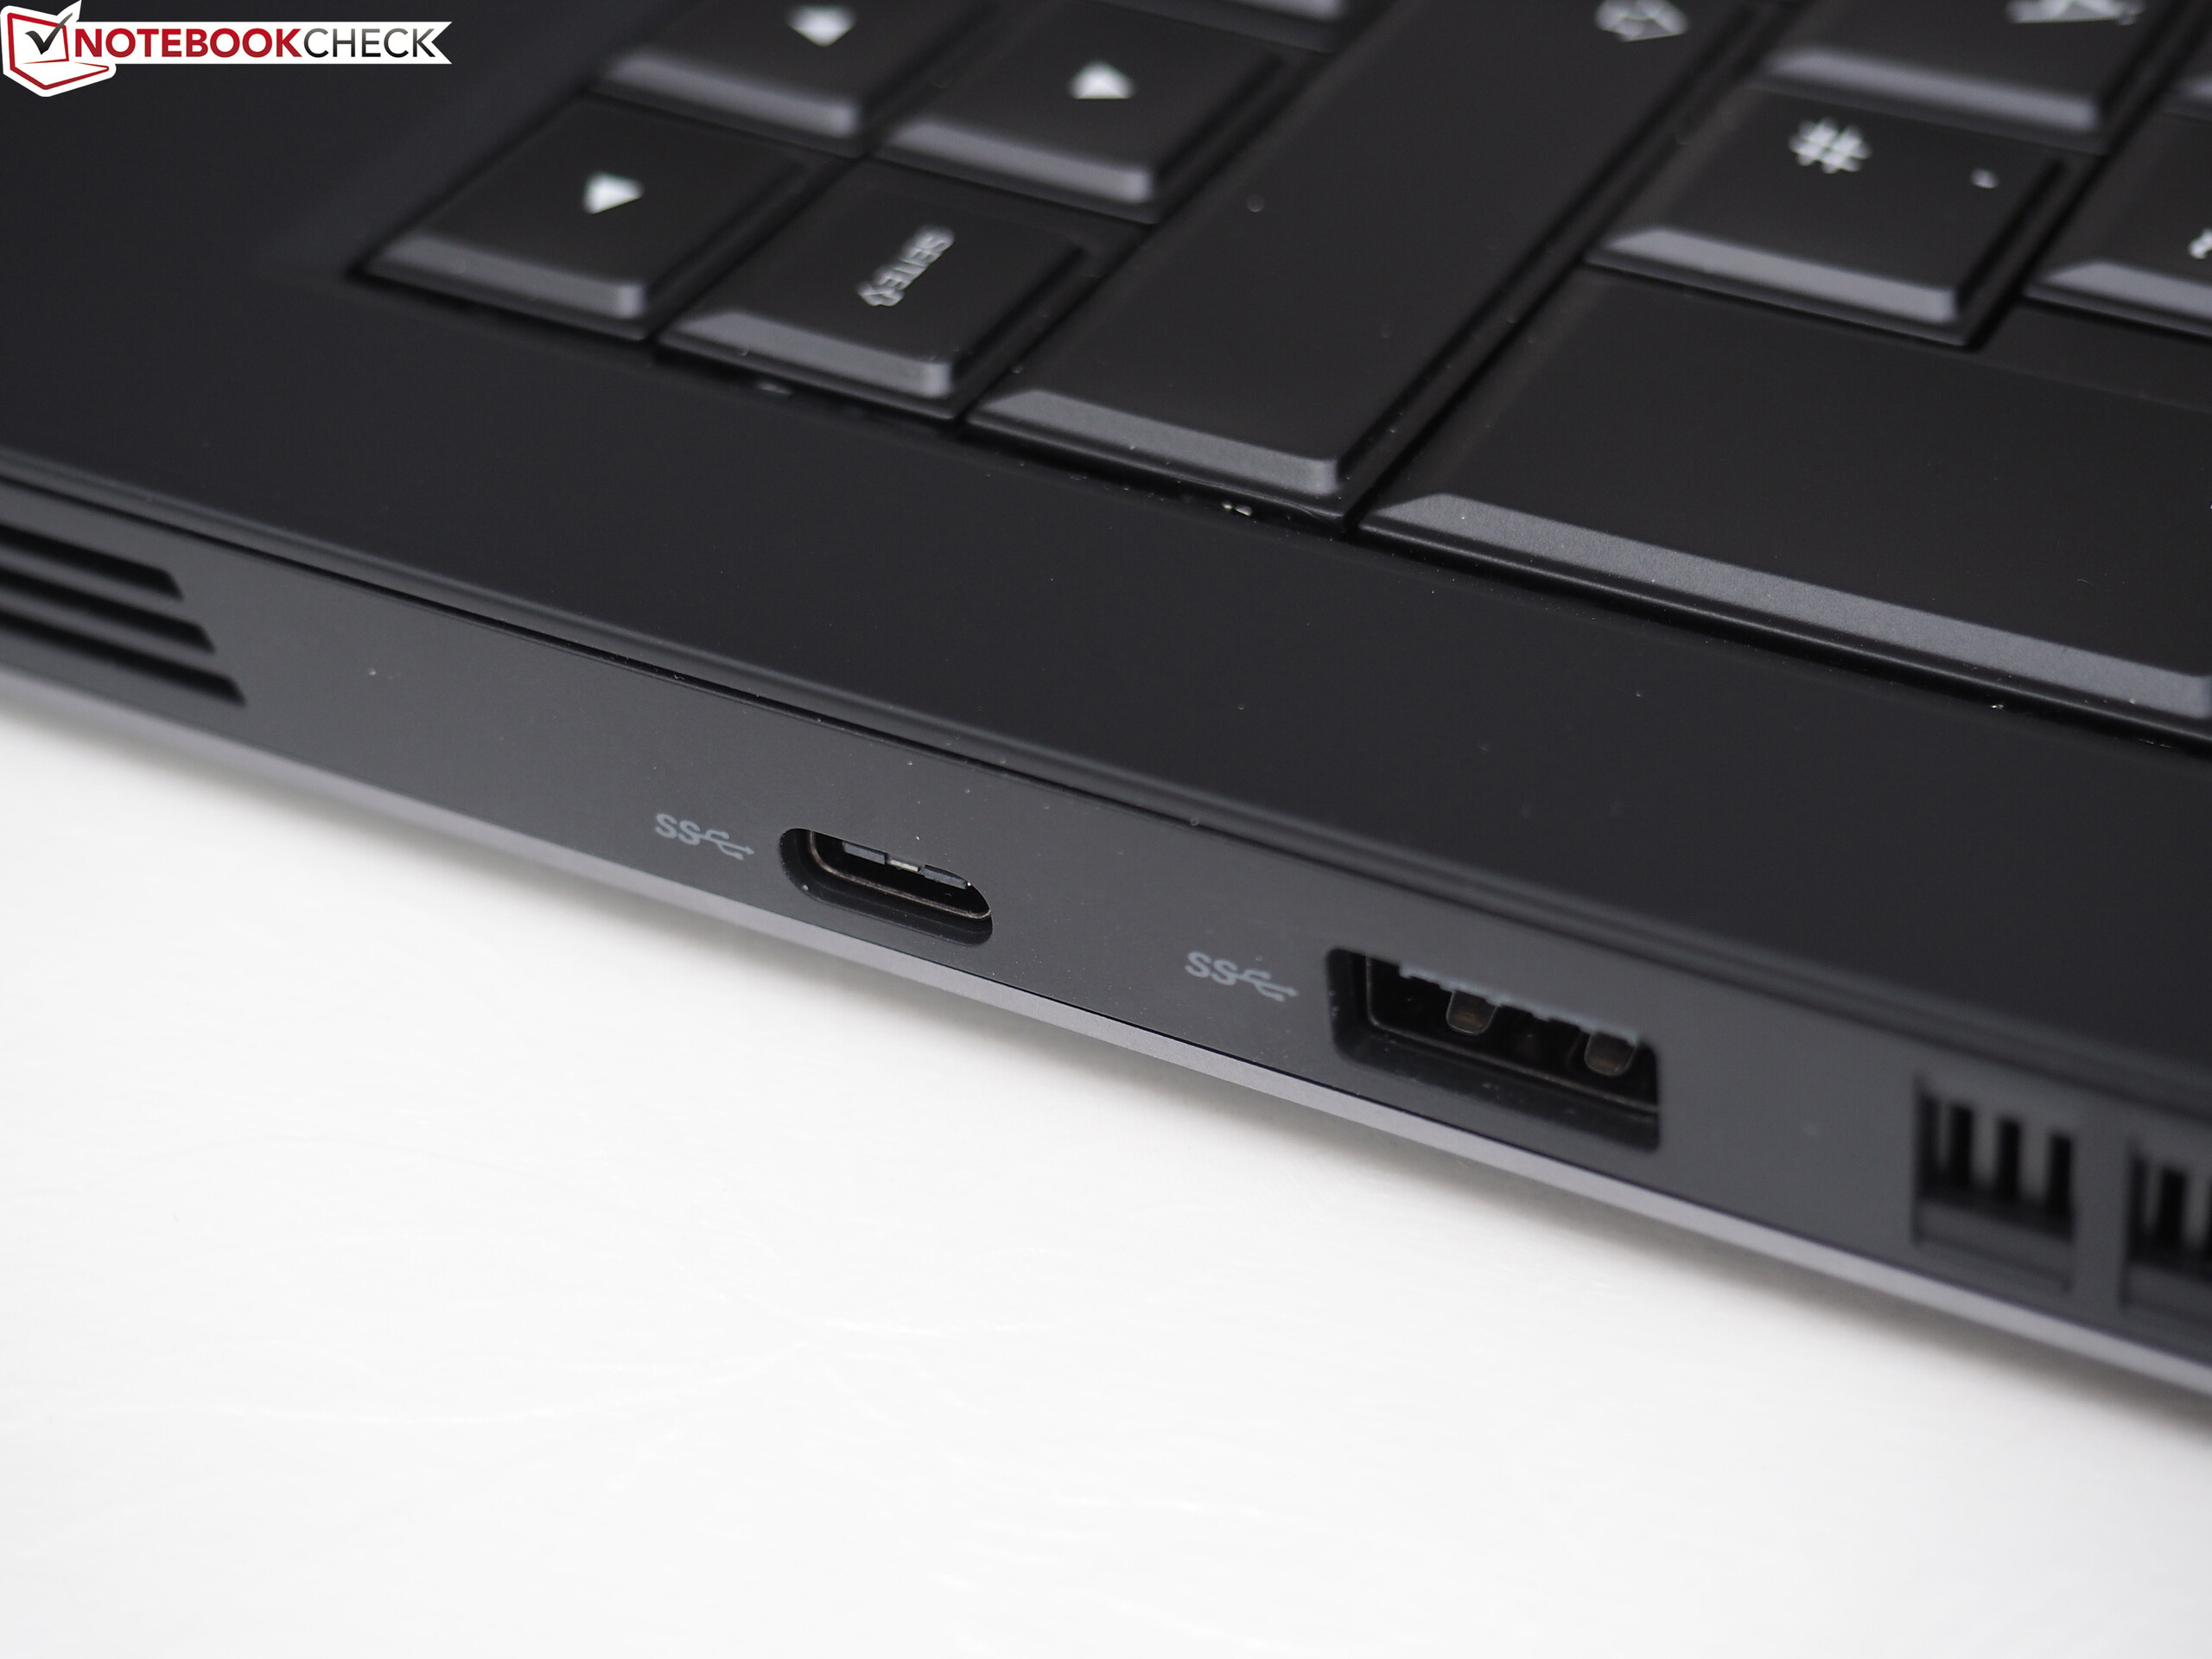
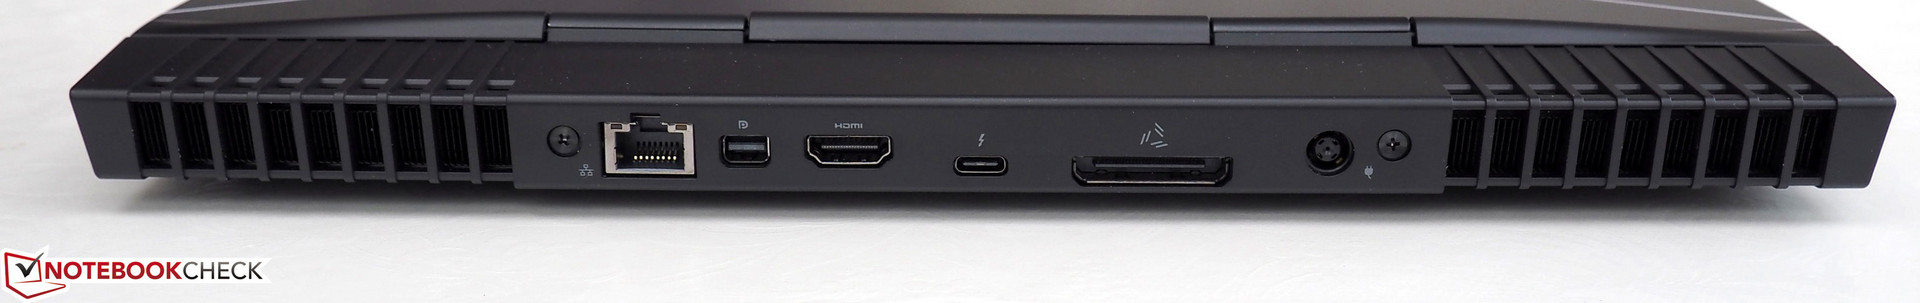
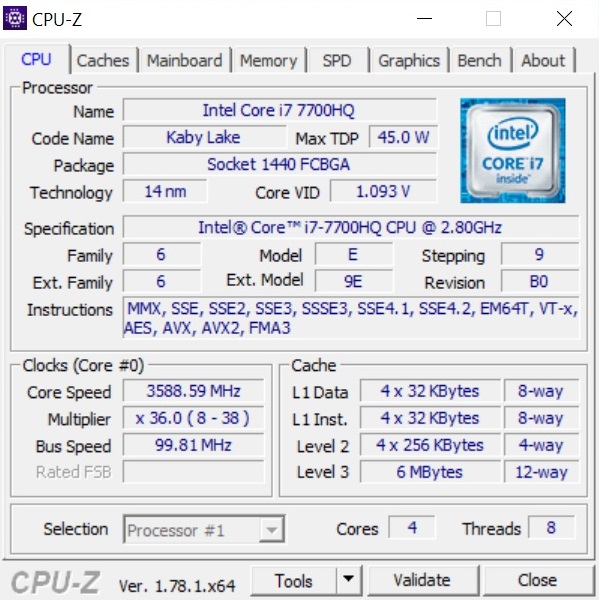
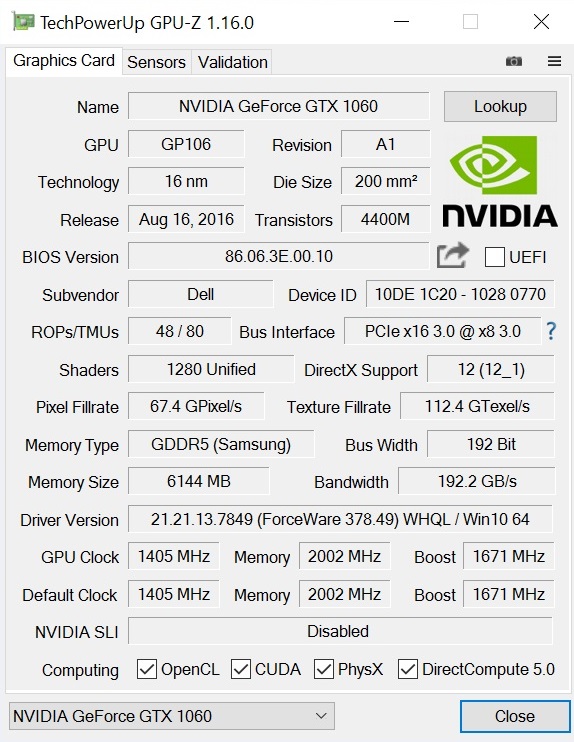
生产商为它配备了目前最新最强的硬件。从眼球追踪,到M.2 NVMe固态硬盘,以及Kaby Lake处理器搭配英伟达的最新帕斯卡架构高端显卡,戴尔尝试着为它的高价位搭配物有所值的表现。骨灰级玩家可能会为没有G-Sync和更高刷新率的屏幕感到遗憾。不过,你可以通过HDMI 2.0或者mini-DisplayPort连接外置显示器。由于支持Thunderbolt 3和Alienware特有的Graphics Amplifier,它也可以连接外置显卡。
整体上,Alienware 13 R3不仅是目前最强大的13寸设备,也是最优秀的游戏笔记本电脑之一。它几乎没有任何值得挑剔的缺陷,也因而成为了我们Top 10中排名第一的设备。甚至是品质极高的Razer Blade也落后了一些(总分85%)。
注:本文是基于完整评测的缩减版本,阅读完整的英文评测,请点击这里。
Alienware 13 R3
-
02/14/2017 v6(old)
Florian Glaser
Pricecompare