AMD Radeon R5 (Kaveri)
AMD Radeon R5(Kaveri)是一款支持DirectX 11.2的集成显卡,很多AMD Kaveri APU都采用了这款显卡。根据APU型号的不同,它提供256个GCN架构着色器和4个运算核心(在A8 Pro-7150B中是384个着色器和6个运算核心),例如A8-7200P处理器版本。它的最大核心频率和内存频率取决于处理器的版本:在超低电压版处理器中仅支持DDR3-1600,而在普通电压版处理器中则支持最高DDR3-1866。 架构和功能 得力于新的GCN 1.1架构,Kaveri显卡相对于基于VLIW架构的前作Richland和Trinity有了更高的能效和更高的性能表现。这款显卡现在可以支持DirectX 11.2 T2与AMD Mantle API标准。它同样支持对很多应用程序例如Adobe Photoshop通过OpenCL提供硬件加速。 重新设计的Kaveri视频引擎包括了UVD(Unified Video Decoder)4.2和VCE(Video Codec Engine)2.0。对H.264编码的支持也在不同方面得到了改进。不过它对H.265编码并没有完全提供硬件支持。 性能 Radeon R5的不同处理器版本由于在核心频率、和内存支持上的巨大差异而有很大的性能差异。在A8 Pro-7150B中,它最快的版本可以与GeForce GT 720M性能相当,而较慢的版本(在A8-7100中)仅与GeForce 710M性能相当。因此,2014年的游戏可以在低设定和1024x768或1366x768分辨率下流畅运行。 功耗 Kaveri APU处理器的整体功耗为低电压版的17W或普通电压版的35W。因此这款28纳米芯片适合于中小尺寸的笔记本电脑。 Radeon R (Kaveri) Series Codename Kaveri Architecture GCN 1.1 Pipelines 256 - unified Core Speed 514 - 626 (Boost) MHz Memory Bus Width 64/128 Bit Shared Memory yes API DirectX 12 (FL 12_0), Shader 5.0 Transistor Count 2.4 Billion technology 28 nm Features UVD 4.2, VCE 2.0 Notebook Size medium sized Date of Announcement 04.06.2014
CPU in Radeon R5 (Kaveri) GPU Base Speed GPU Boost / Turbo AMD A8-7200P 4 x 2400 MHz, 35 W 553 MHz 626 MHz AMD A8 Pro-7150B 4 x 1900 MHz, 19 W ? MHz 533 MHz AMD A8-7100 4 x 1800 MHz, 19 W ? MHz 514 MHz min. - max. 553 - ? MHz 514 - 626 MHz
Benchmarks Performance Rating - 3DMark 11 + Fire Strike + Time Spy
0.3 pt (1%)
...
AMD Radeon R2 (Stoney Ridge)
AMD Radeon HD 8450G + Radeon HD 8570M Dual Graphics
Intel UHD Graphics (Elkhart Lake 16 EU)
Intel HD Graphics 4400
AMD Radeon R4 (Stoney Ridge)
Intel HD Graphics 510
AMD Radeon HD 7640G + HD 7610M Dual Graphics
...
max:
3DMark - 3DMark Cloud Gate Score
2594 Points (3%)
Intel Graphics Media Accelerator (GMA) 4500MHD
...
AMD Radeon R2 (Stoney Ridge)
AMD Radeon R4 (Stoney Ridge)
AMD Radeon HD 8330
Intel HD Graphics (Haswell)
AMD Radeon HD 8450G
AMD Radeon HD 8610G
AMD Radeon HD 8400
AMD Radeon HD 8450G + Radeon HD 8570M Dual Graphics
Intel HD Graphics 4200
Intel UHD Graphics (Elkhart Lake 16 EU)
...
max:
3DMark - 3DMark Cloud Gate Graphics
3959 Points (1%)
Intel Graphics Media Accelerator (GMA) 4500MHD
...
AMD Radeon R4 (Kaveri)
Intel HD Graphics (Haswell)
Intel UHD Graphics 605
AMD Radeon HD 8450G
Intel UHD Graphics (Elkhart Lake 16 EU)
Intel HD Graphics 4200
Intel HD Graphics (Broadwell)
AMD Radeon R5 M335
AMD Radeon R5 M230
...
max:
3DMark - 3DMark Fire Strike Standard Score
527 Points (1%)
...
AMD Radeon HD 8610G
AMD Radeon HD 8450G
Intel UHD Graphics 605
AMD Radeon R2 (Stoney Ridge)
Intel UHD Graphics (Elkhart Lake 16 EU)
Intel HD Graphics 4400
AMD Radeon HD 7640G + HD 7610M Dual Graphics
Intel HD Graphics 510
...
max:
3DMark - 3DMark Fire Strike Standard Graphics
572 Points (1%)
...
AMD Radeon R2 (Stoney Ridge)
AMD Radeon HD 8450G + Radeon HD 8570M Dual Graphics
Intel UHD Graphics (Elkhart Lake 16 EU)
AMD Radeon R4 (Stoney Ridge)
Intel HD Graphics 4400
Intel HD Graphics 510
AMD Radeon HD 7640G + HD 7610M Dual Graphics
Intel UHD Graphics 610
Intel HD Graphics 515
...
max:
3DMark - 3DMark Ice Storm Graphics
36559 Points (4%)
Intel Graphics Media Accelerator (GMA) 4500MHD
...
Intel HD Graphics (Haswell)
AMD Radeon R4 (Stoney Ridge)
AMD Radeon R7 M260X
NVIDIA Quadro RTX 4000 Max-Q
AMD FirePro M4100
Intel UHD Graphics 610
AMD Radeon HD 8610G
Intel UHD Graphics Xe 16EUs (Tiger Lake-H)
NVIDIA Quadro K620M
Intel HD Graphics 4400
Intel UHD Graphics Xe 750 32EUs (Rocket Lake)
...
max:
3DMark 11 - 3DM11 Performance Score
min: 964 avg: 1020 median: 1020 (1%) max: 1076 Points
...
AMD Radeon HD 8610G
Intel HD Graphics 510
Intel UHD Graphics 610
...
max:
3DMark 11 - 3DM11 Performance GPU
901 Points (1%)
...
Intel HD Graphics 510
AMD Radeon R4 (Stoney Ridge)
AMD Radeon HD 8610G
Intel UHD Graphics 610
...
max:
3DMark Vantage + 3DMark Vantage - 3DM Vant. Perf. total
3011 Points (1%)
...
NVIDIA Quadro FX 2700M
ATI Mobility Radeon HD 4670
NVIDIA GeForce 9700M GTS
AMD Radeon HD 8450G + Radeon HD 8570M Dual Graphics
NVIDIA GeForce 9800M GS
...
max:
NVIDIA T600
3DM Vant. Perf. GPU no PhysX + 3DMark Vantage - 3DM Vant. Perf. GPU no PhysX
2674 Points (2%)
...
NVIDIA Quadro FX 2700M
NVIDIA GeForce 9700M GTS
ATI Mobility Radeon HD 4670
NVIDIA GeForce 9800M GS
...
max:
3DMark 06 3DMark 06 - Standard 1280x1024 +
4317 Points (6%)
...
ATI Mobility Radeon HD 2600 XT
Intel UHD Graphics 605
AMD Radeon HD 8450G + Radeon HD 8570M Dual Graphics
AMD Radeon R4 (Stoney Ridge)
ATI Mobility FireGL V5700
ATI Mobility Radeon HD 3670
NVIDIA GeForce 9600M GS
NVIDIA GeForce Go 7900 GTX
...
max:
Unigine Heaven 2.1 - Heaven 2.1 high
11.3 fps (2%)
...
AMD Radeon HD 8650G
Intel HD Graphics 4400
Intel HD Graphics (Broadwell)
...
Cinebench R10 Cinebench R10 Shading (32bit) + Cinebench R10 - Cinebench R10 Shading (32bit)
3611 points (3%)
Intel Graphics Media Accelerator (GMA) 500
...
NVIDIA GeForce GT 240M
ATI Mobility Radeon HD 4870 X2
NVIDIA GeForce 8700M GT
AMD Radeon HD 8450G + Radeon HD 8570M Dual Graphics
AMD Radeon R2 (Stoney Ridge)
ATI Mobility Radeon HD 4570
NVIDIA GeForce 9600M GT
NVIDIA GeForce 9800M GS
...
Cinebench R11.5 Cinebench R11.5 OpenGL 64 Bit + Cinebench R11.5 - Cinebench R11.5 OpenGL 64 Bit
16.3 fps (6%)
Intel Graphics Media Accelerator (GMA) 4500MHD
...
NVIDIA GeForce GT 240M
AMD Radeon R4 (Stoney Ridge)
AMD Radeon HD 8350G
AMD Radeon HD 8450G
Intel HD Graphics 4400
Intel HD Graphics 510
...
max:
Cinebench R15 + Cinebench R15 - Cinebench R15 OpenGL 64 Bit
18 fps (1%)
Intel Graphics Media Accelerator (GMA) 4500MHD
...
Intel UHD Graphics 600
Intel HD Graphics 4200
AMD Radeon HD 8610G
AMD Radeon HD 8350G
Intel HD Graphics (Broadwell)
AMD Radeon R4 (Stoney Ridge)
Intel UHD Graphics 605
AMD Radeon HD 8450G
Intel HD Graphics 4400
AMD Radeon R6 (Carrizo)
...
Cinebench R15 OpenGL Ref. Match 64 Bit + Cinebench R15 - Cinebench R15 OpenGL Ref. Match 64 Bit
98 % (98%)
...
Intel Iris Plus Graphics G7 (Ice Lake 64 EU)
AMD Radeon 610M
AMD Radeon 680M
AMD Radeon 660M
Intel Iris Pro Graphics 580
Intel Iris Plus Graphics G4 (Ice Lake 48 EU)
Intel Iris Graphics 540
Intel Iris Plus Graphics 640
Intel UHD Graphics 617
...
GFXBench 3.0 - GFXBench 3.0 Manhattan Offscreen
14.4 fps (1%)
...
Intel HD Graphics (Bay Trail)
Intel HD Graphics (Cherry Trail)
AMD Radeon R4 (Kaveri)
AMD Radeon HD 8610G
Intel HD Graphics (Braswell)
Intel HD Graphics 4400
AMD Radeon R2 (Stoney Ridge)
AMD Radeon R4 (Stoney Ridge)
Intel UHD Graphics 600
...
LuxMark v2.0 64Bit - LuxMark v2.0 Room GPU
97 Samples/s (0%)
...
AMD Radeon R4 (Stoney Ridge)
Intel HD Graphics (Haswell)
Intel UHD Graphics 605
NVIDIA GeForce 910M
AMD Radeon 610M
NVIDIA Quadro K610M
Intel HD Graphics 4200
AMD Radeon HD 7640G + HD 7610M Dual Graphics
NVIDIA GeForce GT 735M
...
max:
4x NVIDIA RTX A6000
LuxMark v2.0 64Bit - LuxMark v2.0 Sala GPU
183 Samples/s (0%)
...
NVIDIA Quadro K1100M
Intel UHD Graphics (Elkhart Lake 16 EU)
NVIDIA Quadro K2100M
Intel HD Graphics 4200
AMD Radeon R4 (Stoney Ridge)
Intel HD Graphics (Broadwell)
AMD Radeon 610M
NVIDIA GeForce 910M
Intel HD Graphics 4400
...
max:
4x NVIDIA RTX A6000
ComputeMark v2.1 - ComputeMark v2.1 Result
520 points (1%)
...
Intel HD Graphics 4200
Intel UHD Graphics 605
Intel HD Graphics 510
NVIDIA GeForce GT 740M
Intel HD Graphics 4400
AMD Radeon HD 7640G + HD 7610M Dual Graphics
AMD Radeon HD 8550G
...
max:
- Range of benchmark values for this graphics card
- Average benchmark values for this graphics card
* Smaller numbers mean a higher performance
Game Benchmarks The following benchmarks stem from our benchmarks of review laptops. The performance depends on the used graphics memory, clock rate, processor, system settings, drivers, and operating systems. So the results don't have to be representative for all laptops with this GPU. For detailed information on the benchmark results, click on the fps number.
Intel HD Graphics (Braswell)
...
AMD Radeon HD 8330
AMD Radeon R4 (Stoney Ridge)
Intel UHD Graphics 605
AMD Radeon HD 8350G
Intel HD Graphics (Haswell)
AMD Radeon HD 8610G
AMD Radeon R6 M255DX
AMD Radeon R8 M365DX
NVIDIA GeForce 910M
Intel HD Graphics 515
...
max:
...
AMD Radeon R2 (Stoney Ridge)
AMD Radeon HD 8330
Intel UHD Graphics 605
Intel HD Graphics (Haswell)
AMD Radeon HD 8350G
AMD Radeon HD 8610G
Intel HD Graphics (Broadwell)
AMD Radeon R4 (Stoney Ridge)
Intel HD Graphics 515
Intel HD Graphics 4400
AMD Radeon R6 M255DX
Intel Iris Graphics 5100
...
» The benchmarks indicate that the game is not playable in the tested settings.
Intel HD Graphics (Bay Trail)
Intel HD Graphics 4200
Intel Iris Graphics 5100
AMD Radeon HD 8350G
Intel HD Graphics 4400
Intel HD Graphics 5000
AMD Radeon R5 M230
...
Intel HD Graphics (Bay Trail)
Intel Iris Graphics 5100
Intel HD Graphics 4400
AMD Radeon R5 M230
Intel HD Graphics 5000
...
» The benchmarks indicate that the game is not playable in the tested settings.
Intel HD Graphics (Bay Trail)
Intel HD Graphics 4200
AMD Radeon HD 8330
Intel HD Graphics (Haswell)
Intel HD Graphics 4400
AMD Radeon R6 M255DX
...
NVIDIA Quadro M5000M
Intel HD Graphics (Bay Trail)
Intel HD Graphics 4200
Intel HD Graphics (Haswell)
AMD Radeon HD 8330
AMD Radeon R6 M255DX
Intel HD Graphics 4400
Intel HD Graphics 5000
NVIDIA GeForce GT 720M
...
NVIDIA Quadro M5000M
» The benchmarks indicate that the game is not playable in the tested settings.
Intel HD Graphics (Bay Trail)
...
Intel HD Graphics (Braswell)
AMD Radeon HD 8330
Intel UHD Graphics 605
AMD Radeon R2 (Stoney Ridge)
Intel HD Graphics (Haswell)
AMD Radeon HD 8350G
AMD Radeon R7 M260
AMD Radeon R5 M330
AMD Radeon RX Vega 6 (Ryzen 2000/3000)
Intel Iris Graphics 5100
...
max:
NVIDIA GeForce GTX 1060 (Desktop)
Intel HD Graphics (Bay Trail)
...
AMD Radeon HD 8330
AMD Radeon R2 (Stoney Ridge)
Intel HD Graphics (Haswell)
Intel UHD Graphics 605
AMD Radeon R5 M330
AMD Radeon HD 8350G
Intel HD Graphics 4400
AMD Radeon R7 M260
AMD Radeon R5 M230
...
max:
NVIDIA GeForce GTX 1060 (Desktop)
» The benchmarks indicate that the game is not playable in the tested settings.
Intel HD Graphics (Bay Trail)
AMD Radeon R4 (Kaveri)
AMD Radeon R8 M365DX
Intel HD Graphics 4200
Intel HD Graphics (Cherry Trail)
Intel HD Graphics (Haswell)
AMD Radeon HD 8330
AMD Radeon HD 8400
AMD Radeon HD 8350G
Intel HD Graphics 4400
...
Intel HD Graphics (Bay Trail)
Intel HD Graphics 4200
Intel HD Graphics (Haswell)
AMD Radeon HD 8330
AMD Radeon HD 8400
AMD Radeon R8 M365DX
Intel HD Graphics 4400
AMD Radeon R5 M230
Intel HD Graphics 5000
...
max:
NVIDIA GeForce GTX 970
» The benchmarks indicate that the game is not playable in the tested settings.
...
AMD Radeon HD 8400
Intel HD Graphics 4200
AMD Radeon HD 8610G
AMD Radeon HD 8350G
Intel HD Graphics 4400
AMD Radeon HD 8450G
Intel HD Graphics 520
AMD Radeon R5 M330
AMD Radeon R6 M255DX
...
...
Intel UHD Graphics 605
Intel HD Graphics (Haswell)
AMD Radeon HD 8610G
Intel HD Graphics 4200
AMD Radeon HD 8350G
AMD Radeon HD 8450G
Intel HD Graphics 4400
AMD Radeon R6 M255DX
AMD Radeon R5 M330
...
NVIDIA GeForce GTX 780M
max:
» The benchmarks indicate that the game is not playable in the tested settings.
...
AMD Radeon HD 8350G
AMD Radeon R4 (Stoney Ridge)
Intel HD Graphics 4200
Intel HD Graphics (Broadwell)
AMD Radeon HD 8330
AMD Radeon HD 8450G
Intel HD Graphics (Haswell)
Intel UHD Graphics 605
AMD Radeon HD 8610G
AMD Radeon R6 M255DX
Intel UHD Graphics 600
AMD Radeon HD 8400
AMD Radeon R8 M365DX
AMD Radeon R5 (Bristol Ridge)
...
Intel HD Graphics (Bay Trail)
...
AMD Radeon HD 8610G
AMD Radeon HD 8400
Intel HD Graphics (Broadwell)
AMD Radeon HD 8350G
AMD Radeon R4 (Stoney Ridge)
Intel HD Graphics 4400
Intel HD Graphics 515
AMD Radeon R6 M255DX
AMD Radeon R5 (Bristol Ridge)
AMD Radeon HD 8450G
...
» With all tested laptops playable in detail settings low.
Intel HD Graphics (Bay Trail)
AMD Radeon HD 8330
AMD Radeon HD 8400
Intel HD Graphics (Haswell)
AMD Radeon R6 M255DX
AMD Radeon HD 8350G
Intel HD Graphics 4400
Intel Iris Graphics 5100
Intel HD Graphics 4200
...
Intel HD Graphics (Bay Trail)
Intel HD Graphics (Haswell)
AMD Radeon R5 M230
Intel HD Graphics 4400
Intel HD Graphics 4200
Intel HD Graphics 5000
AMD Radeon R6 M255DX
...
» The benchmarks indicate that the game is not playable in the tested settings.
...
AMD Radeon R4 (Kaveri)
AMD Radeon HD 8280
AMD Radeon HD 8330
AMD Radeon HD 8610G
AMD Radeon HD 8350G
Intel HD Graphics (Haswell)
AMD Radeon HD 8400
AMD Radeon HD 8450G
Intel HD Graphics 4200
Intel HD Graphics 4400
AMD Radeon R5 M240
Intel HD Graphics 5000
...
Intel HD Graphics (Bay Trail)
...
AMD Radeon R4 (Kaveri)
Intel HD Graphics (Haswell)
Intel HD Graphics 4200
AMD Radeon HD 8610G
AMD Radeon HD 8350G
Intel HD Graphics 4400
AMD Radeon HD 8450G
Intel HD Graphics 515
Intel HD Graphics 5000
...
AMD Radeon R4 (Kaveri)
AMD Radeon HD 8330
Intel HD Graphics 4200
Intel HD Graphics 4400
Intel HD Graphics 515
Intel HD Graphics 5000
AMD Radeon HD 8450G
AMD Radeon R5 M230
...
NVIDIA Quadro P5200
» The benchmarks indicate that the game is not playable in the tested settings.
...
AMD Radeon HD 8280
AMD Radeon HD 8330
AMD Radeon R5 M240
AMD Radeon HD 8400
Intel HD Graphics (Haswell)
AMD Radeon R6 M255DX
Intel HD Graphics 4200
AMD Radeon HD 8610G
Intel HD Graphics 4400
Intel Iris Graphics 550
...
...
AMD Radeon HD 8400
AMD Radeon R5 M240
Intel HD Graphics (Haswell)
Intel HD Graphics 4200
AMD Radeon HD 8610G
AMD Radeon R6 M255DX
AMD Radeon HD 8350G
AMD Radeon HD 8450G
...
AMD Radeon HD 8400
AMD Radeon HD 8610G
AMD Radeon R5 M240
AMD Radeon HD 8450G
AMD Radeon R6 M255DX
AMD Radeon HD 8650G + HD 8570M Dual Graphics
...
» The benchmarks indicate that the game is not playable in the tested settings.
Intel HD Graphics (Bay Trail)
AMD Radeon HD 8210
Intel HD Graphics (Cherry Trail)
AMD Radeon HD 8280
Intel HD Graphics 4200
AMD Radeon HD 8330
Intel HD Graphics (Haswell)
AMD Radeon HD 8400
Intel HD Graphics 4400
...
NVIDIA GeForce GTX 980 (Laptop)
max:
NVIDIA Titan RTX
AMD Radeon HD 8280
Intel HD Graphics (Haswell)
Intel HD Graphics 4400
...
NVIDIA GeForce GTX 980 (Laptop)
max:
NVIDIA Titan RTX
Intel HD Graphics 4200
Intel HD Graphics 4400
AMD Radeon R6 (Carrizo)
Intel HD Graphics 515
Intel HD Graphics (Haswell)
AMD Radeon HD 8350G
Intel HD Graphics 5000
...
NVIDIA GeForce GTX 980 (Laptop)
max:
NVIDIA Titan RTX
» The benchmarks indicate that the game is not playable in the tested settings.
...
Intel HD Graphics (Bay Trail)
AMD Radeon HD 8210
AMD Radeon HD 8280
Intel HD Graphics (Haswell)
AMD Radeon HD 8330
Intel HD Graphics 4200
AMD Radeon HD 8400
AMD Radeon HD 8450G
Intel HD Graphics 4400
AMD Radeon HD 8650G
AMD Radeon HD 8650G + HD 8570M Dual Graphics
...
NVIDIA Quadro P4000 Max-Q
max:
Intel HD Graphics (Bay Trail)
Intel HD Graphics (Haswell)
AMD Radeon HD 8280
AMD Radeon HD 8400
Intel HD Graphics 4200
Intel HD Graphics 4400
AMD Radeon HD 8450G
AMD Radeon HD 8650G
AMD Radeon R5 M230
...
NVIDIA Quadro P4000 Max-Q
AMD Radeon R5 M230
Intel Iris Graphics 5100
AMD Radeon HD 8650G + HD 8570M Dual Graphics
...
NVIDIA Quadro P4000 Max-Q
» The benchmarks indicate that the game is not playable in the tested settings.
Intel HD Graphics (Bay Trail)
...
AMD Radeon HD 8330
Intel HD Graphics (Haswell)
AMD Radeon HD 8400
AMD Radeon HD 8650G + HD 8570M Dual Graphics
Intel HD Graphics 4200
AMD Radeon HD 8450G
AMD Radeon HD 8350G
Intel HD Graphics 4400
AMD Radeon HD 8550G + HD 8750M Dual Graphics
...
NVIDIA Quadro M5000M
...
Intel HD Graphics (Haswell)
AMD Radeon HD 8400
AMD Radeon HD 8650G + HD 8570M Dual Graphics
Intel HD Graphics 4200
AMD Radeon HD 8450G
Intel HD Graphics 4400
AMD Radeon HD 8350G
AMD Radeon HD 8550G + HD 8750M Dual Graphics
...
NVIDIA Quadro M5000M
Intel HD Graphics 4200
AMD Radeon HD 8650G + HD 8570M Dual Graphics
AMD Radeon HD 8450G
Intel HD Graphics 4400
AMD Radeon HD 8350G
Intel HD Graphics 5000
AMD Radeon HD 8650G
...
» The benchmarks indicate that the game is not playable in the tested settings.
Intel HD Graphics (Braswell)
...
Intel HD Graphics (Haswell)
AMD Radeon HD 8450G
Intel HD Graphics 4400
AMD Radeon HD 8610G
AMD Radeon HD 8400
AMD Radeon R5 M240
AMD Radeon R6 M255DX
AMD Radeon R7 M260
AMD Radeon HD 8550G + HD 8670M Dual Graphics
AMD Radeon HD 8550G + HD 8750M Dual Graphics
AMD Radeon HD 8650G + HD 8670M Dual Graphics
...
AMD FirePro M6100
max:
Intel HD Graphics (Braswell)
...
AMD Radeon HD 8280
Intel HD Graphics 4400
AMD Radeon HD 8610G
AMD Radeon HD 8450G
AMD Radeon HD 8400
AMD Radeon R5 M240
AMD Radeon R6 M255DX
AMD Radeon R7 M260
AMD Radeon HD 8550G + HD 8750M Dual Graphics
AMD Radeon HD 8550G + HD 8670M Dual Graphics
AMD Radeon HD 8650G + HD 8670M Dual Graphics
...
AMD FirePro M5100
...
Intel HD Graphics 4400
AMD Radeon HD 8650G + HD 8570M Dual Graphics
AMD Radeon HD 8450G
AMD Radeon HD 8650G
Intel Iris Graphics 5100
AMD Radeon HD 8550G + HD 8670M Dual Graphics
AMD Radeon R5 M240
AMD Radeon R6 M255DX
AMD Radeon R5 M230
AMD Radeon R7 M260
...
» The benchmarks indicate that the game is not playable in the tested settings.
...
Intel HD Graphics (Haswell)
Intel HD Graphics 4400
AMD Radeon HD 8330
AMD Radeon HD 8400
AMD Radeon HD 8450G
AMD Radeon HD 8550G + HD 8670M Dual Graphics
AMD Radeon R5 M230
AMD Radeon HD 8650G + HD 8670M Dual Graphics
AMD Radeon HD 8650G
AMD Radeon HD 8650G + HD 8570M Dual Graphics
Intel Iris Graphics 5100
...
NVIDIA GeForce GTX 960M
Intel HD Graphics (Bay Trail)
AMD Radeon HD 8250
Intel HD Graphics 4200
Intel HD Graphics (Haswell)
AMD Radeon HD 8280
AMD Radeon HD 8330
AMD Radeon HD 8400
Intel HD Graphics 4400
AMD Radeon HD 8450G
AMD Radeon HD 8550G + HD 8670M Dual Graphics
...
NVIDIA GeForce GTX 780M SLI
Intel HD Graphics 4200
AMD Radeon HD 8550G + HD 8670M Dual Graphics
AMD Radeon HD 8450G
NVIDIA GeForce GT 720M
Intel Iris Graphics 5100
...
NVIDIA GeForce GTX 780M SLI
» The benchmarks indicate that the game is not playable in the tested settings.
...
Intel HD Graphics 4400
AMD Radeon HD 8610G
AMD Radeon HD 8330
AMD Radeon R4 (Stoney Ridge)
AMD Radeon HD 8550G
AMD Radeon R5 M240
Intel HD Graphics 4200
AMD Radeon R7 M260
AMD Radeon HD 8550G + HD 8670M Dual Graphics
Intel HD Graphics 5000
...
...
AMD Radeon HD 8450G
AMD Radeon HD 8330
AMD Radeon HD 8400
AMD Radeon HD 8610G
Intel HD Graphics 4400
Intel HD Graphics 4200
AMD Radeon R4 (Stoney Ridge)
Intel HD Graphics 5000
AMD Radeon R5 M240
AMD Radeon R7 M260
...
NVIDIA Quadro M1000M
max:
...
AMD Radeon HD 8280
AMD Radeon HD 8330
AMD Radeon HD 8610G
Intel HD Graphics 4400
Intel HD Graphics 4200
AMD Radeon HD 8450G
AMD Radeon R4 (Stoney Ridge)
Intel HD Graphics 5000
...
max:
» With all tested laptops playable in detail settings low.
...
AMD Radeon HD 8400
Intel HD Graphics 4200
AMD Radeon HD 8330
Intel HD Graphics (Broadwell)
AMD Radeon HD 8450G
AMD Radeon HD 8650G + HD 8570M Dual Graphics
AMD Radeon R5 M230
Intel HD Graphics 5000
Intel HD Graphics 515
Intel HD Graphics 4400
...
...
Intel HD Graphics 4200
Intel HD Graphics (Broadwell)
Intel HD Graphics 4400
Intel HD Graphics 5000
AMD Radeon HD 8650G + HD 8570M Dual Graphics
AMD Radeon R5 M230
AMD Radeon R7 M260
...
AMD Radeon HD 8210
Intel HD Graphics 4200
Intel HD Graphics (Broadwell)
AMD Radeon HD 8450G
NVIDIA Quadro K610M
AMD Radeon HD 8650G + HD 8570M Dual Graphics
...
» The benchmarks indicate that the game is not playable in the tested settings.
...
Intel HD Graphics (Haswell)
AMD Radeon HD 8450G + Radeon HD 8570M Dual Graphics
Intel HD Graphics 4400
AMD Radeon R4 (Stoney Ridge)
AMD Radeon R2 (Stoney Ridge)
AMD Radeon R5 M230
Intel HD Graphics 5000
...
Intel HD Graphics (Bay Trail)
...
Intel HD Graphics (Broadwell)
AMD Radeon R4 (Stoney Ridge)
Intel HD Graphics 4400
AMD Radeon HD 8450G
AMD Radeon R2 (Stoney Ridge)
AMD Radeon HD 8450G + Radeon HD 8570M Dual Graphics
Intel HD Graphics 515
Intel HD Graphics 510
...
Intel HD Graphics (Bay Trail)
...
Intel HD Graphics (Haswell)
AMD Radeon R4 (Stoney Ridge)
AMD Radeon HD 8450G
Intel HD Graphics 4400
AMD Radeon R2 (Stoney Ridge)
Intel HD Graphics 5000
...
» The benchmarks indicate that the game is not playable in the tested settings.
...
AMD Radeon HD 8240
AMD Radeon HD 8280
Intel HD Graphics (Bay Trail)
AMD Radeon HD 8330
AMD Radeon HD 8400
NVIDIA GeForce G210M
Intel UHD Graphics 600
Intel HD Graphics 515
AMD Radeon R5 M240
...
NVIDIA Quadro P5200
Intel Graphics Media Accelerator (GMA) 4500MHD
...
Intel HD Graphics 515
NVIDIA GeForce G210M
AMD Radeon HD 8330
AMD Radeon HD 8400
Intel HD Graphics (Haswell)
Intel Iris Plus Graphics G4 (Ice Lake 48 EU)
AMD Radeon HD 8450G
Intel HD Graphics 4400
Intel HD Graphics 4200
...
NVIDIA Quadro P5200
...
Intel HD Graphics (Haswell)
Intel HD Graphics 4400
AMD Radeon HD 8450G
AMD Radeon HD 8610G
Intel HD Graphics 4200
Intel Iris Graphics 5100
AMD Radeon R5 M230
AMD Radeon HD 8550G + HD 8670M Dual Graphics
...
NVIDIA Quadro P5200
» With all tested laptops playable in detail settings low.
...
AMD Radeon HD 8610G
AMD Radeon HD 8450G + Radeon HD 8570M Dual Graphics
Intel UHD Graphics 600
Intel HD Graphics (Broadwell)
AMD Radeon R2 (Stoney Ridge)
AMD Radeon R4 (Stoney Ridge)
AMD Radeon HD 8450G
Intel HD Graphics 4400
Intel HD Graphics 515
AMD Radeon HD 8350G
...
...
Intel HD Graphics 4200
Intel UHD Graphics 600
AMD Radeon HD 8610G
Intel HD Graphics (Broadwell)
Intel UHD Graphics 605
AMD Radeon HD 8450G + Radeon HD 8570M Dual Graphics
AMD Radeon R4 (Stoney Ridge)
Intel HD Graphics 515
AMD Radeon HD 8350G
AMD Radeon HD 8450G
Intel HD Graphics 4400
...
...
AMD Radeon R2 (Stoney Ridge)
Intel HD Graphics (Broadwell)
Intel UHD Graphics 605
Intel HD Graphics 4400
AMD Radeon R4 (Stoney Ridge)
AMD Radeon HD 8450G
AMD Radeon HD 8350G
Intel HD Graphics 5000
...
» With all tested laptops playable in detail settings low.
Intel Graphics Media Accelerator (GMA) 4500MHD
...
AMD Radeon HD 8450G
AMD Radeon R2 (Stoney Ridge)
AMD Radeon HD 8400
AMD Radeon R4 (Stoney Ridge)
NVIDIA GeForce G210M
Intel HD Graphics 4200
AMD Radeon HD 8280
AMD Radeon R5 (Bristol Ridge)
...
NVIDIA GeForce GTX 765M SLI
...
AMD Radeon HD 8400
AMD Radeon R2 (Stoney Ridge)
Intel HD Graphics 4200
AMD Radeon HD 8450G
AMD Radeon R4 (Stoney Ridge)
Intel HD Graphics 4400
AMD Radeon HD 8450G + Radeon HD 8570M Dual Graphics
...
NVIDIA GeForce GTX 780M SLI
...
AMD Radeon HD 8280
Intel HD Graphics 4200
AMD Radeon R2 (Stoney Ridge)
AMD Radeon HD 8450G
AMD Radeon R4 (Stoney Ridge)
Intel HD Graphics 4400
AMD Radeon HD 8450G + Radeon HD 8570M Dual Graphics
...
NVIDIA GeForce GTX 780M SLI
» With all tested laptops playable in detail settings low.
Intel Graphics Media Accelerator (GMA) 4500MHD
...
AMD Radeon HD 8400
Intel HD Graphics (Haswell)
AMD Radeon HD 8330
NVIDIA GeForce G210M
Intel HD Graphics 4400
AMD Radeon HD 8550G + HD 8670M Dual Graphics
Intel Iris Graphics 5100
AMD Radeon R5 M240
...
Intel HD Graphics (Bay Trail)
...
Intel HD Graphics 4200
Intel HD Graphics (Haswell)
AMD Radeon HD 8330
NVIDIA GeForce G210M
NVIDIA GeForce GT 735M
Intel HD Graphics 4400
AMD Radeon HD 8550G + HD 8670M Dual Graphics
...
NVIDIA GeForce GTX 780M SLI
...
Intel HD Graphics 4200
AMD Radeon HD 8330
NVIDIA GeForce G210M
NVIDIA GeForce GT 735M
Intel HD Graphics 4400
AMD Radeon HD 8550G + HD 8670M Dual Graphics
...
NVIDIA GeForce GTX 780M SLI
» The benchmarks indicate that the game is not playable in the tested settings.
...
Intel HD Graphics (Broadwell)
AMD Radeon HD 8450G
Intel UHD Graphics 610
AMD Radeon HD 8610G
AMD Radeon R4 (Stoney Ridge)
AMD Radeon HD 8450G + Radeon HD 8570M Dual Graphics
AMD Radeon R6 (Carrizo)
Intel HD Graphics 4400
AMD Radeon R5 (Bristol Ridge)
...
...
NVIDIA GeForce G210M
AMD Radeon HD 8610G
Intel UHD Graphics 610
AMD Radeon HD 8450G
AMD Radeon R4 (Stoney Ridge)
Intel HD Graphics 4400
AMD Radeon R6 (Carrizo)
...
Intel HD Graphics (Bay Trail)
...
Intel HD Graphics (Broadwell)
AMD Radeon HD 8400
NVIDIA GeForce G210M
AMD Radeon HD 8450G
AMD Radeon R4 (Stoney Ridge)
Intel HD Graphics 4400
AMD Radeon R5 M230
...
» With all tested laptops playable in detail settings low.
Intel HD Graphics (Bay Trail)
...
Intel HD Graphics 4200
AMD Radeon HD 8210
NVIDIA GeForce G210M
AMD Radeon HD 8330
AMD Radeon HD 8450G
Intel HD Graphics 4400
AMD Radeon HD 8450G + Radeon HD 8570M Dual Graphics
...
NVIDIA GeForce GTX 765M SLI
Intel HD Graphics (Bay Trail)
Intel HD Graphics 4200
AMD Radeon HD 8450G
AMD Radeon HD 8550G + HD 8670M Dual Graphics
AMD Radeon HD 8450G + Radeon HD 8570M Dual Graphics
...
AMD Radeon HD 8970M Crossfire
» The benchmarks indicate that the game is not playable in the tested settings.
...
AMD Radeon HD 8450G
AMD Radeon R2 (Stoney Ridge)
Intel HD Graphics 515
Intel HD Graphics 4400
...
max:
AMD Radeon HD 7870
...
AMD Radeon R2 (Stoney Ridge)
AMD Radeon HD 8350G
AMD Radeon R4 (Stoney Ridge)
Intel HD Graphics 4400
AMD Radeon HD 8450G + Radeon HD 8570M Dual Graphics
...
NVIDIA GeForce GTX 780M SLI
...
AMD Radeon R2 (Stoney Ridge)
AMD Radeon HD 8610G
AMD Radeon HD 8210
AMD Radeon HD 8350G
Intel HD Graphics 4400
AMD Radeon R4 (Stoney Ridge)
AMD Radeon HD 8450G + Radeon HD 8570M Dual Graphics
...
NVIDIA GeForce GTX 780M SLI
» With all tested laptops playable in detail settings low.
...
AMD Radeon HD 8610G
AMD Radeon R2 (Stoney Ridge)
AMD Radeon R4 (Stoney Ridge)
AMD Radeon HD 8650G + HD 8570M Dual Graphics
...
...
AMD Radeon HD 8610G
Intel HD Graphics 5000
Intel HD Graphics 515
Intel Iris Graphics 5100
Intel HD Graphics 520
...
...
Intel HD Graphics 5000
Intel HD Graphics 515
AMD Radeon HD 8450G
Intel Iris Graphics 5100
Intel HD Graphics 520
...
» The benchmarks indicate that the game is not playable in the tested settings.
Intel Graphics Media Accelerator (GMA) 4500MHD
...
Intel HD Graphics (Haswell)
AMD Radeon HD 8450G
AMD Radeon HD 8450G + Radeon HD 8570M Dual Graphics
AMD Radeon HD 8610G
AMD Radeon R2 (Stoney Ridge)
AMD Radeon R4 (Stoney Ridge)
AMD Radeon R5 M230
...
NVIDIA Quadro K3100M
...
AMD Radeon HD 8450G
AMD Radeon R2 (Stoney Ridge)
Intel UHD Graphics 605
AMD Radeon R4 (Stoney Ridge)
AMD Radeon HD 8450G + Radeon HD 8570M Dual Graphics
Intel HD Graphics 515
Intel Iris Graphics 5100
...
» With all tested laptops playable in detail settings low.
...
Intel UHD Graphics 605
AMD Radeon R2 (Stoney Ridge)
AMD Radeon HD 8400
AMD Radeon R4 (Stoney Ridge)
...
...
AMD Radeon R2 (Stoney Ridge)
AMD Radeon HD 8400
...
NVIDIA Quadro M5000M
...
Intel Iris Graphics 5100
Intel HD Graphics 4400
AMD Radeon R4 (Stoney Ridge)
...
NVIDIA Quadro M5000M
» With all tested laptops playable in detail settings low.
For more games that might be playable and a list of all games and graphics cards visit our Gaming List
v1.26
log 13. 13:14:38
#0 no ids found in url (should be separated by "_") +0s ... 0s
#1 not redirecting to Ajax server +0s ... 0s
#2 did not recreate cache, as it is less than 5 days old! Created at Sat, 13 Apr 2024 05:44:32 +0200 +0.001s ... 0.001s
#3 no comparison url found in template nbc.compare_page_1 needed +0.061s ... 0.062s
#4 no comparison url found in template nbc.compare_page_1 needed +0s ... 0.062s
#5 no comparison url found in template nbc.compare_page_1 needed +0s ... 0.063s
#6 no comparison url found in template nbc.compare_page_1 needed +0s ... 0.063s
#7 no comparison url found in template nbc.compare_page_1 needed +0s ... 0.063s
#8 composed specs +0s ... 0.063s
#9 did output specs +0s ... 0.063s
#10 start showIntegratedCPUs +0s ... 0.063s
#11 getting avg benchmarks for device 5540 +0.035s ... 0.099s
#12 got single benchmarks 5540 +0.013s ... 0.112s
#13 got avg benchmarks for devices +0s ... 0.112s
#14 min, max, avg, median took s +0.549s ... 0.661s
#15 before gaming benchmark output +0s ... 0.661s
#16 Got 74 rows for game benchmarks. +0.016s ... 0.677s
#17 composed SQL query for gamebenchmarks +0s ... 0.677s
#18 got data and put it in $dataArray +0.024s ... 0.701s
#19 benchmarks composed for output. +0.873s ... 1.574s
#20 no comparison url found in template nbc.compare_page_1 needed +0.004s ... 1.578s
#21 return log +0s ... 1.578s
Notebook reviews with AMD Radeon R5 (Kaveri) graphics card
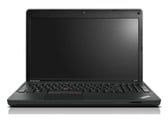
联想 ThinkPad E555 笔记本电脑简短评测 变脸。 联想再次为个人和商务用户推出了最新型号的低价ThinkPad E系列设备。相比前代产品它有一些外观上的变化——不过你依然可以得到一块磨砂表面屏幕和高质量的键盘。...
AMD A8-7100 | AMD Radeon R5 (Kaveri) | 15.60" | 2.4 kg
HP Elitebook 725-F1Q18EA : AMD A8 Pro-7150B, 12.50", 1.4 kgExternal Review » HP Elitebook 725-F1Q18EA
Lenovo Thinkpad E555 : AMD A8-7100, 15.60", 2.4 kgExternal Review » Lenovo Thinkpad E555
HP ProBook 455 G2 : AMD A8-7100, 15.60", 2.3 kgExternal Review » HP ProBook 455 G2
HP 15-g094sa : AMD A8-6410, 15.60", 2.2 kgExternal Review » HP 15-g094sa
HP Pavilion x360 13z Touch : AMD A8-6410, 13.30", 1.8 kgExternal Review » HP Pavilion x360 13z Touch
Please share our article, every link counts!
» Comparison of GPUs
» Benchmark List
» Notebook Gaming List
Class 1 GeForce RTX 2080 Super Mobile
Class 2 M1 Max 32-Core GPU *
GeForce RTX 2070 Super Mobile
M1 Max 24-Core GPU *
Quadro RTX 5000 Max-Q
Radeon RX 5700M *
GeForce GTX 1080 Mobile
Quadro RTX 4000 (Laptop)
M1 Pro 16-Core GPU *
Radeon PRO W6600M *
GeForce RTX 2070 Super Max-Q
Quadro RTX 4000 Max-Q *
M1 Pro 14-Core GPU *
Quadro P5200
Quadro RTX 3000 Max-Q *
Quadro P4200
Quadro P5000 Max-Q *
GeForce GTX 980 (Laptop)
Quadro P4000
Quadro P4000 Max-Q
Quadro P3200
Radeon RX 580X (Laptop) *
Radeon RX 580 (Laptop)
Radeon Pro 5300M
Radeon RX 5300M
Quadro P3000 Max-Q *
Quadro T2000 Max-Q *
Radeon Pro WX 7100 *
Radeon RX 570X (Laptop) *
Radeon RX 570 (Laptop) *
Radeon RX 470 (Laptop) *
Quadro T1000 Max-Q *
Class 3 Vega M GH
Quadro M5000M
GeForce GTX 1050 Ti Mobile
Radeon 680M
Quadro P2000
Quadro P2000 Max-Q
Quadro M4000M
T500 Laptop GPU *
Radeon R9 M395X
GeForce GTX 1050 Ti Max-Q *
Radeon Pro Vega 16
WX Vega M GL
Radeon R9 M485X
Quadro M3000M
FirePro W7170M
Radeon R9 M395
GeForce GTX 1050 Max-Q *
Radeon 660M
Radeon Pro WX 4150 *
Radeon RX 560X (Laptop)
Radeon RX 560 (Laptop)
Radeon RX 460 (Laptop)
Quadro P1000
Radeon R9 M390
Xe MAX
Radeon Pro 560X
Radeon Pro 560
Radeon Pro 460
Radeon Pro WX 4130 *
GeForce GTX 960M
Quadro P620 *
Radeon RX 550X (Laptop)
Radeon Pro WX 3200 *
Radeon Pro 555X
Radeon Pro 555
Radeon Pro 455
Quadro P600
Quadro M2000M
Radeon RX 540X *
Radeon Pro WX 2100 *
Radeon Pro WX 3100 *
GeForce GTX 950M
Radeon Pro 450
Radeon 630
Radeon 540X *
Radeon R9 M385X
Quadro P520
Quadro M1000M
GeForce 945M
Quadro P500 *
Iris Plus Graphics G7 (Ice Lake 64 EU) *
Vega 10 *
Iris Pro Graphics 580
FirePro W5170M *
Radeon R9 M370X
Vega 9
FirePro W5130M
UHD Graphics Xe G4 48EUs *
UHD Graphics 32EUs
UHD Graphics Xe 32EUs (Tiger Lake-H) *
UHD Graphics 750
Vega 7
Radeon R7 M465
Iris Pro Graphics 6200
Vega 8
GeForce 940M
Iris Plus Graphics G4 (Ice Lake 48 EU)
Quadro M600M
FirePro W4190M
Radeon R9 M375
Radeon R7 M445
Iris Plus Graphics 650
Iris Graphics 550
Radeon 625
Vega 6 *
Iris Plus Graphics 640
Iris Graphics 540
UHD Graphics 24EUs (Alder Lake-N) *
Radeon R7 M360
GeForce 920M
Radeon 620
Radeon R7 M340
Radeon 610
Radeon 610M *
Vega 6 *
UHD Graphics G1 (Ice Lake 32 EU)
UHD Graphics Xe 16EUs (Tiger Lake-H) *
HD Graphics 530
Radeon R5 (Bristol Ridge)
Adreno 690 *
Adreno 685 *
Adreno 680 *
Radeon R5 M330
GeForce 910M
HD Graphics 520
Class 4 UHD Graphics 730
Radeon R5 M320 *
Radeon R5 M315 *
Radeon R5 M420 *
Vega 2 *
UHD Graphics 617
UHD Graphics 615
HD Graphics 515
UHD Graphics 610
HD Graphics 510
UHD Graphics 605
Radeon R4 (Stoney Ridge)
Radeon R2 (Stoney Ridge)
HD Graphics (Broadwell)
UHD Graphics 600
HD Graphics (Braswell)
Class 5 * Approximate position of the graphics adapter
Klaus Hinum (Update: 2016-01-26)
 Deutsch
 English
 Español
 Français
 Italiano
 Nederlands
 Polski
 Português
 Русский
 Türkçe
 Svenska
 Chinese
 Magyar