 Deutsch
 English
 Español
 Français
 Italiano
 Nederlands
 Polski
 Português
 Русский
 Türkçe
 Svenska
 Chinese
 Magyar
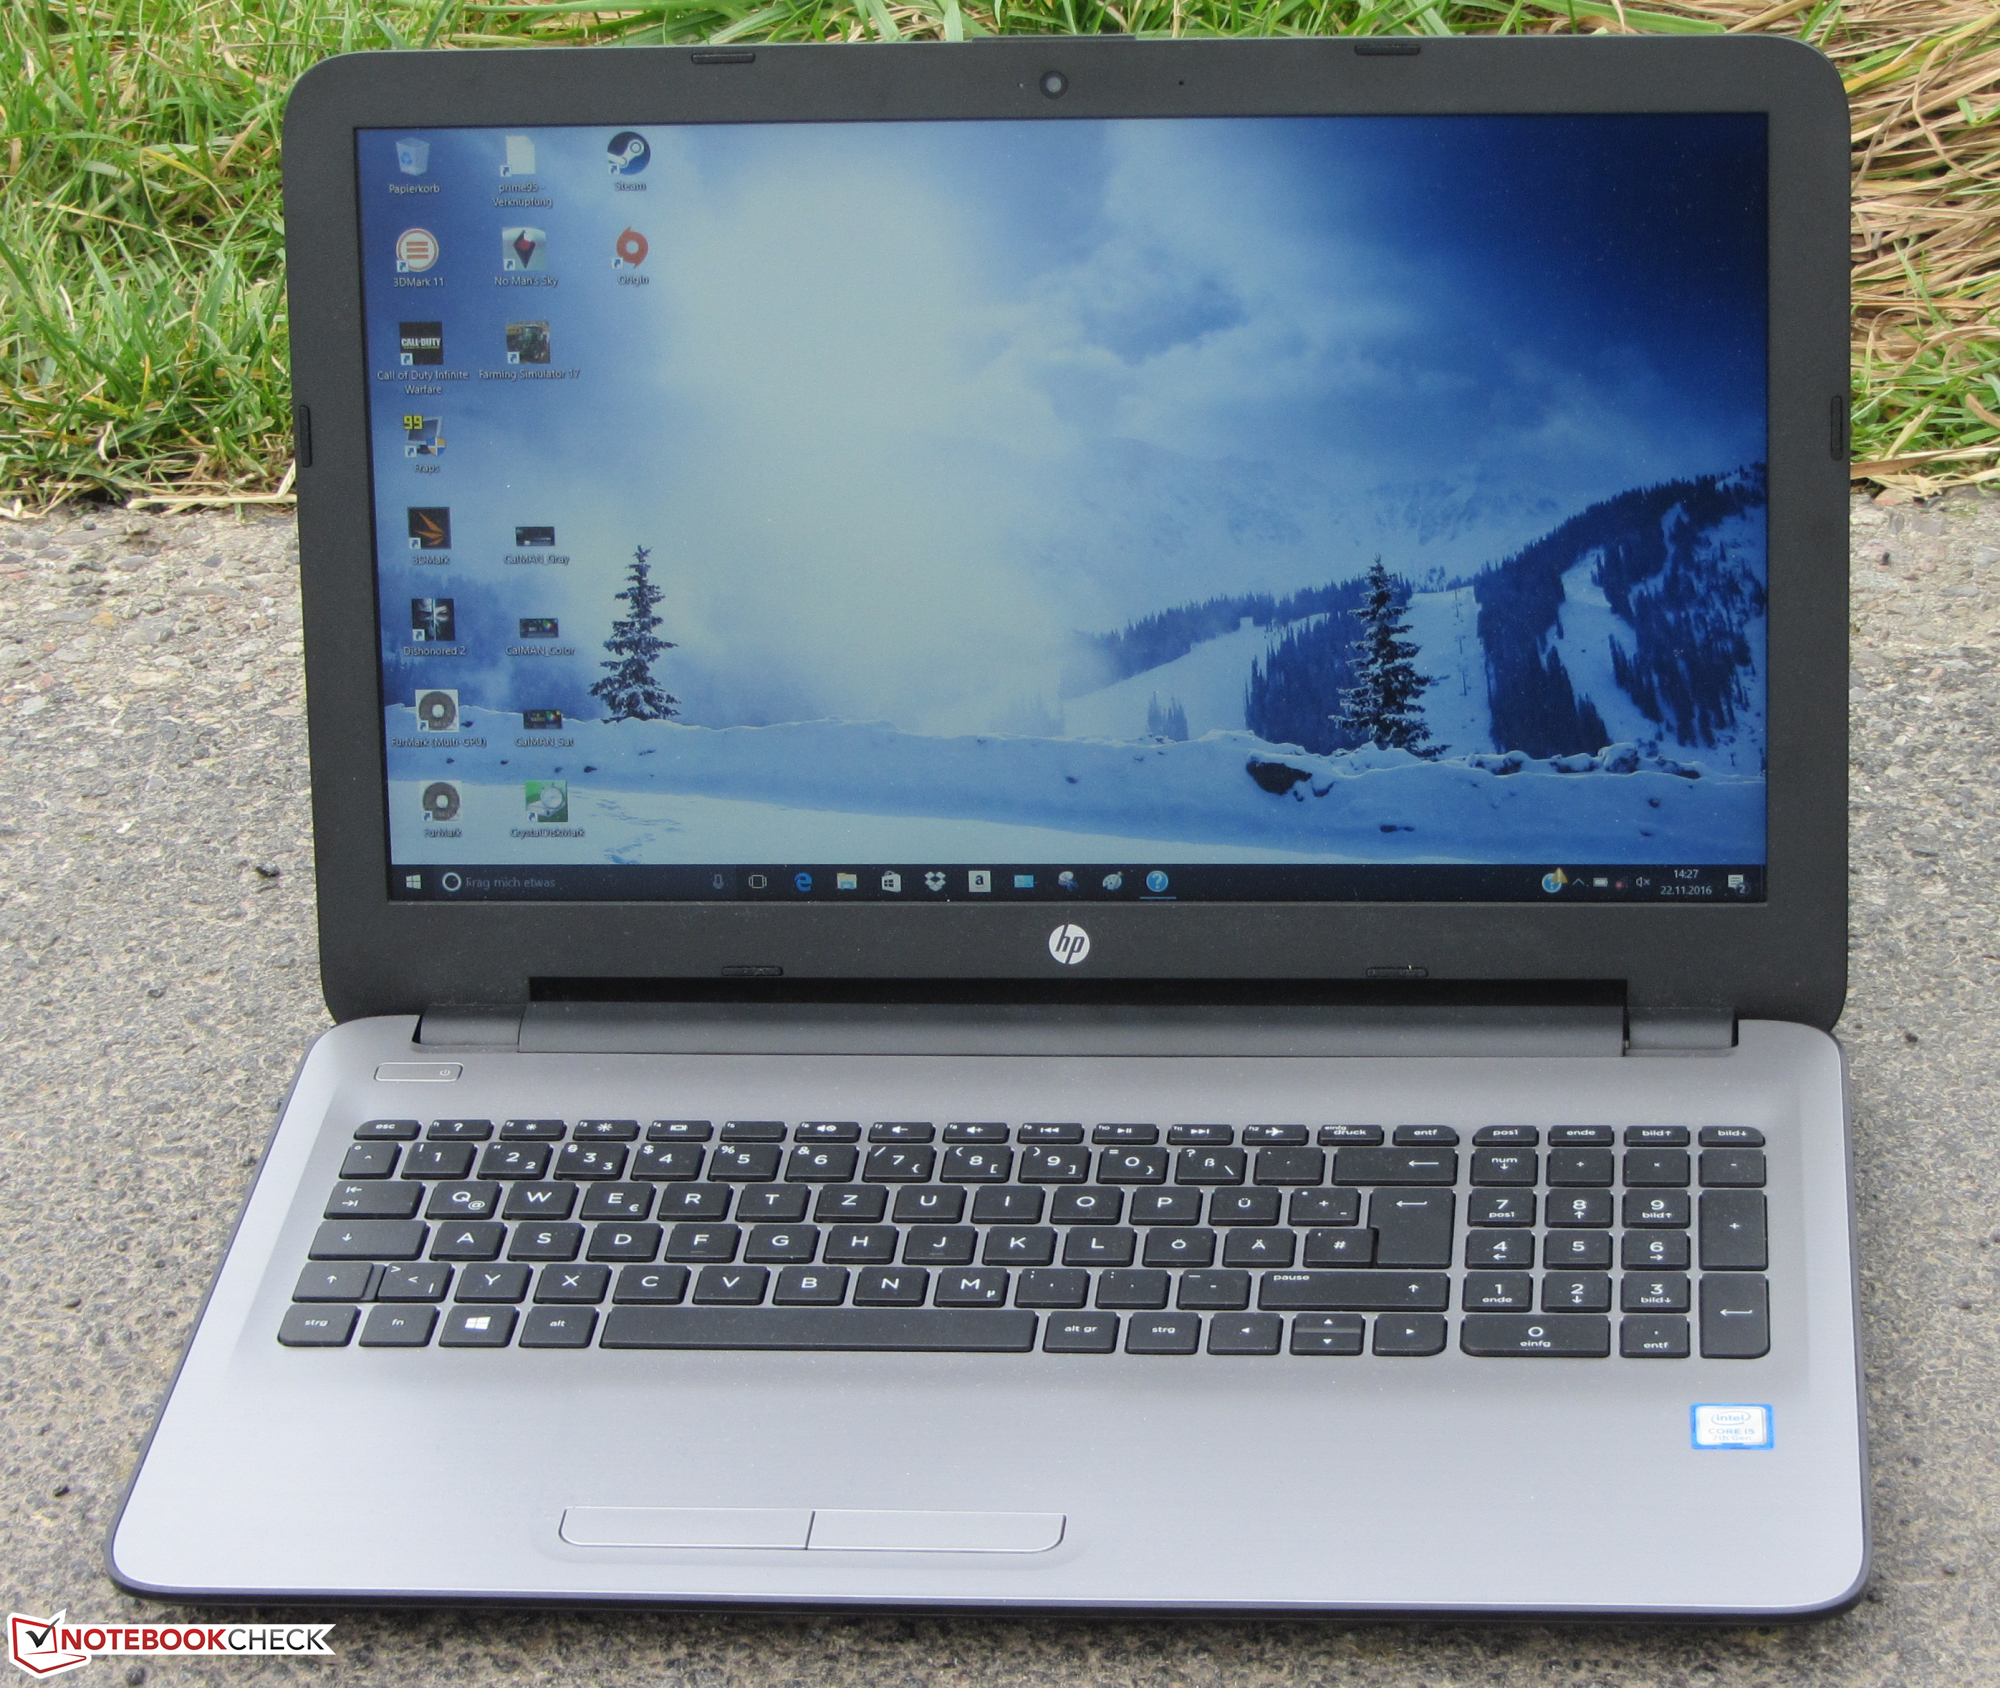
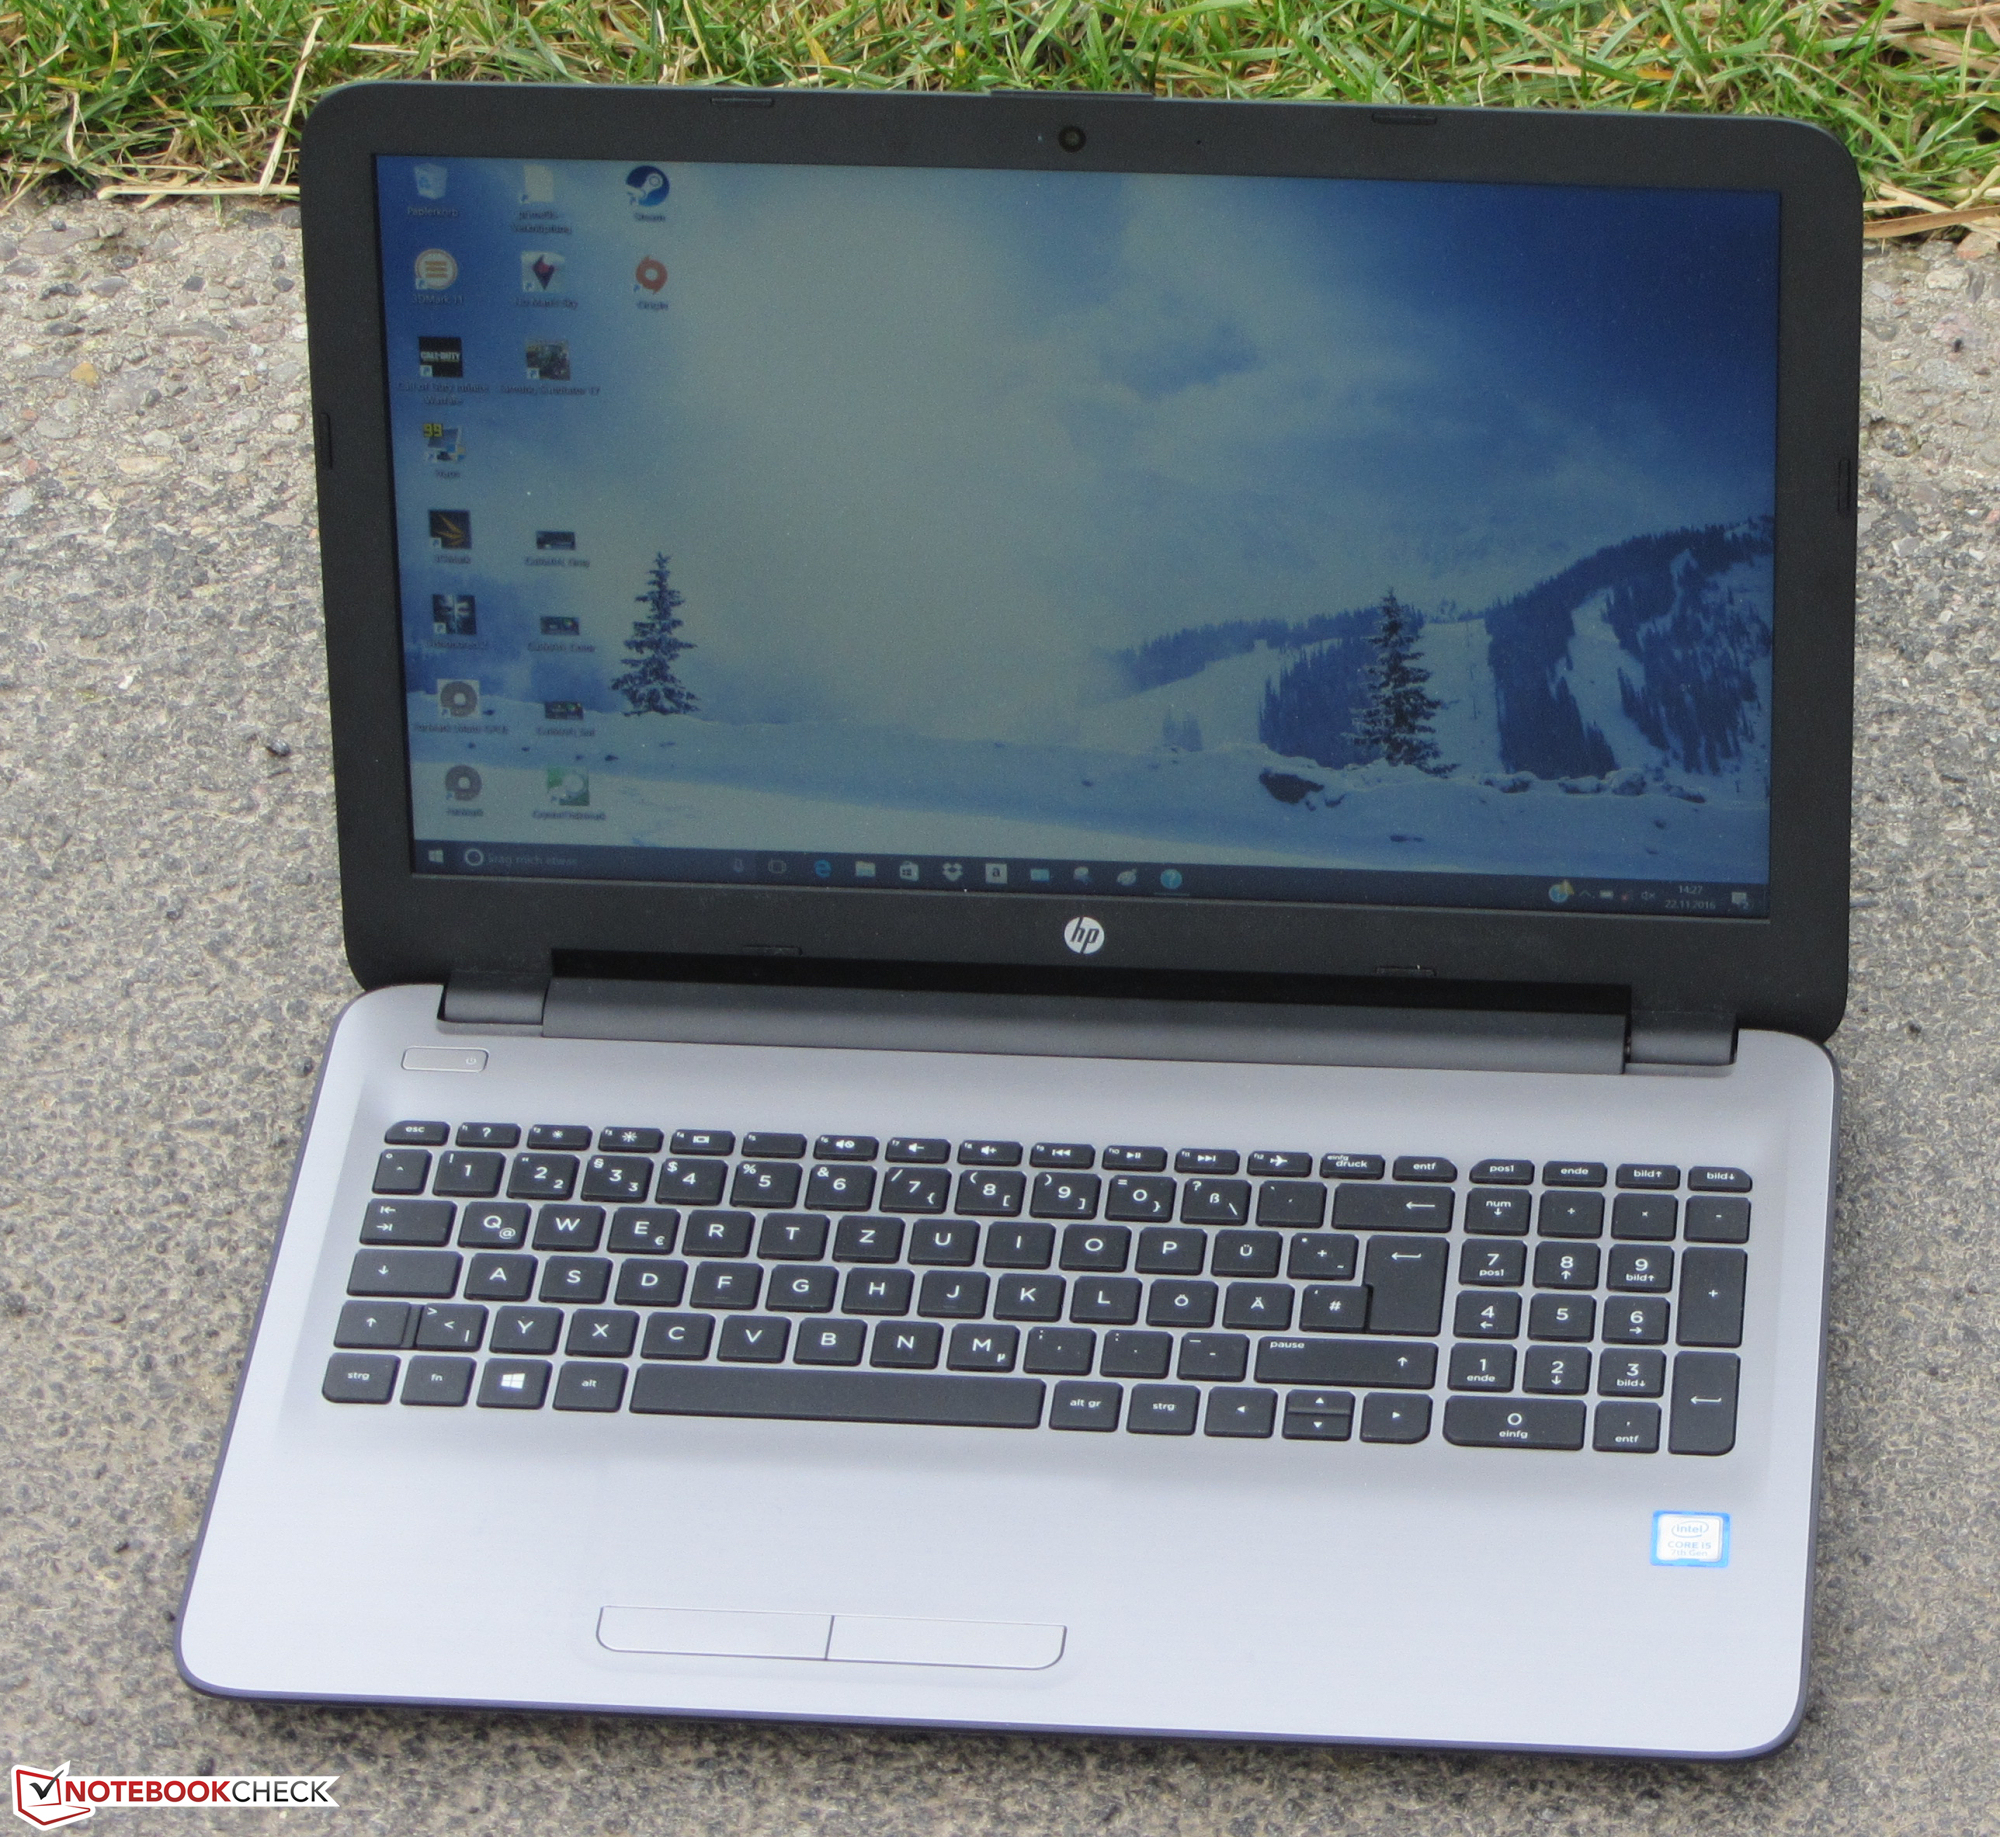
惠普 15-ay116ng Notebook Review
| SD Card Reader | |
| average JPG Copy Test (av. of 3 runs) | |
| Dell Latitude 14 Rugged 5414 | |
| HP 250 G5 SP X0N33EA | |
| Acer Extensa 2520-59CD | |
| Dell Latitude 15-3570 | |
| HP 15-ay116ng | |
| Lenovo B50-50 80S2000QGE | |
| maximum AS SSD Seq Read Test (1GB) | |
| Dell Latitude 14 Rugged 5414 | |
| Lenovo B50-50 80S2000QGE | |
| Acer Extensa 2520-59CD | |
| HP 15-ay116ng | |
| Dell Latitude 15-3570 | |
| Networking | |
| iperf Server (receive) TCP 1 m | |
| HP 250 G5 SP X0N33EA (jseb) | |
| HP 15-ay116ng (jseb) | |
| iperf Client (transmit) TCP 1 m | |
| Acer Extensa 2520-59CD | |
| HP 250 G5 SP X0N33EA (jseb) | |
| HP 15-ay116ng (jseb) | |
| |||||||||||||||||||||||||
Brightness Distribution: 89 %
Center on Battery: 241 cd/m²
Contrast: 566:1 (Black: 0.44 cd/m²)
ΔE Color 11.71 | 0.5-29.43 Ø5
ΔE Greyscale 13.13 | 0.57-98 Ø5.3
56% sRGB (Argyll 1.6.3 3D)
36% AdobeRGB 1998 (Argyll 1.6.3 3D)
38.58% AdobeRGB 1998 (Argyll 2.2.0 3D)
56.2% sRGB (Argyll 2.2.0 3D)
37.34% Display P3 (Argyll 2.2.0 3D)
Gamma: 2.57
| HP 15-ay116ng TN LED, 1920x1080, 15.60 | HP 250 G5 SP X0N33EA TN, 1920x1080, 15.60 | Acer Extensa 2520-59CD TN LED, 1366x768, 15.60 | Lenovo B50-50 80S2000QGE TN LED, 1366x768, 15.60 | Dell Latitude 15-3570 TN LED, 1366x768, 15.60 | |
|---|---|---|---|---|---|
| Display | -2% | 9% | 0% | 9% | |
| Display P3 Coverage | 37.34 | 36.51 -2% | 40.71 9% | 37.24 0% | 40.61 9% |
| sRGB Coverage | 56.2 | 55 -2% | 61.1 9% | 56 0% | 61.1 9% |
| AdobeRGB 1998 Coverage | 38.58 | 37.72 -2% | 42.07 9% | 38.48 0% | 41.96 9% |
| Response Times | 2% | -33% | -31% | -27% | |
| Response Time Grey 50% / Grey 80% * | 40 ? | 40 ? -0% | 52 ? -30% | 58 ? -45% | 37 ? 7% |
| Response Time Black / White * | 23 ? | 22 ? 4% | 31 ? -35% | 27 ? -17% | 37 ? -61% |
| PWM Frequency | 1000 | ||||
| Screen | -4% | -0% | -7% | -11% | |
| Brightness middle | 249 | 219 -12% | 211 -15% | 204 -18% | 202 -19% |
| Brightness | 234 | 222 -5% | 200 -15% | 198 -15% | 211 -10% |
| Brightness Distribution | 89 | 85 -4% | 83 -7% | 85 -4% | 88 -1% |
| Black Level * | 0.44 | 0.39 11% | 0.43 2% | 0.48 -9% | 0.62 -41% |
| Contrast | 566 | 562 -1% | 491 -13% | 425 -25% | 326 -42% |
| Colorchecker dE 2000 * | 11.71 | 12.67 -8% | 10.53 10% | 11.62 1% | 12.35 -5% |
| Colorchecker dE 2000 max. * | 19.51 | 20.99 -8% | 17.79 9% | 19.97 -2% | 19.9 -2% |
| Greyscale dE 2000 * | 13.13 | 13.82 -5% | 11.85 10% | 12.3 6% | 13.46 -3% |
| Gamma | 2.57 86% | 2.63 84% | 2.25 98% | 2.22 99% | 2.44 90% |
| CCT | 15273 43% | 15633 42% | 13758 47% | 13244 49% | 15217 43% |
| Color Space (Percent of AdobeRGB 1998) | 36 | 35 -3% | 39 8% | 36 0% | 39 8% |
| Color Space (Percent of sRGB) | 56 | 55 -2% | 61 9% | 56 0% | 61 9% |
| Total Average (Program / Settings) | -1% /
-3% | -8% /
-3% | -13% /
-9% | -10% /
-9% |
* ... smaller is better
Screen Flickering / PWM (Pulse-Width Modulation)
| Screen flickering / PWM not detected | ||
In comparison: 53 % of all tested devices do not use PWM to dim the display. If PWM was detected, an average of 17915 (minimum: 5 - maximum: 3846000) Hz was measured. | ||
Display Response Times
| ↔ Response Time Black to White | ||
|---|---|---|
| 23 ms ... rise ↗ and fall ↘ combined | ↗ 7 ms rise | 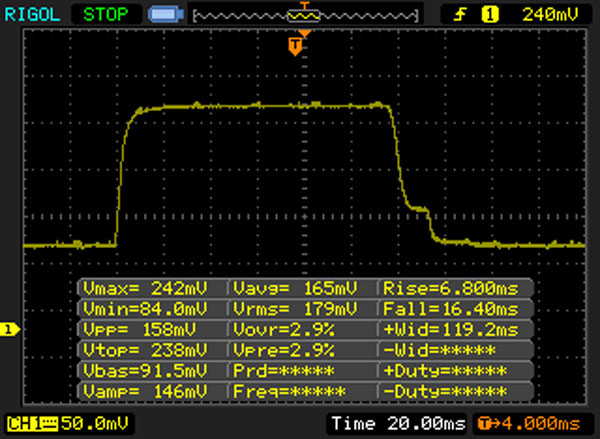 |
| ↘ 16 ms fall | ||
| The screen shows good response rates in our tests, but may be too slow for competitive gamers. In comparison, all tested devices range from 0.1 (minimum) to 240 (maximum) ms. » 45 % of all devices are better. This means that the measured response time is similar to the average of all tested devices (21.5 ms). | ||
| ↔ Response Time 50% Grey to 80% Grey | ||
| 40 ms ... rise ↗ and fall ↘ combined | ↗ 20 ms rise | 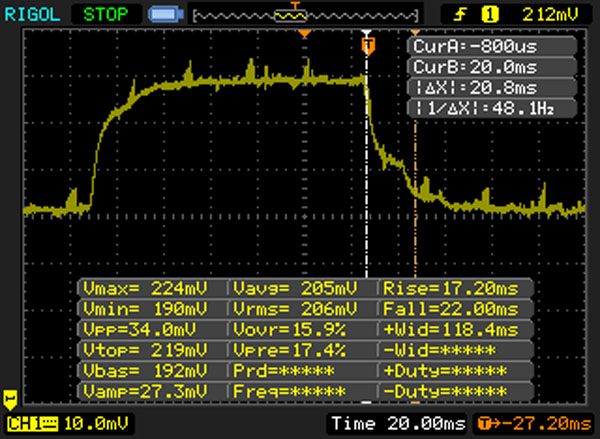 |
| ↘ 20 ms fall | ||
| The screen shows slow response rates in our tests and will be unsatisfactory for gamers. In comparison, all tested devices range from 0.2 (minimum) to 636 (maximum) ms. » 56 % of all devices are better. This means that the measured response time is worse than the average of all tested devices (33.7 ms). | ||
| Cinebench R15 | |
| CPU Single 64Bit | |
| HP 15-ay116ng | |
| Dell Latitude 15-3570 | |
| HP 250 G5 SP X0N33EA | |
| Acer Extensa 2520-59CD | |
| Lenovo B50-50 80S2000QGE | |
| Lenovo Ideapad 500-15ACZ | |
| Lenovo G51-35 80M8002HGE | |
| CPU Multi 64Bit | |
| HP 15-ay116ng | |
| Dell Latitude 15-3570 | |
| HP 250 G5 SP X0N33EA | |
| Acer Extensa 2520-59CD | |
| Lenovo B50-50 80S2000QGE | |
| Lenovo Ideapad 500-15ACZ | |
| Lenovo G51-35 80M8002HGE | |
| Cinebench R10 | |
| Rendering Multiple CPUs 32Bit | |
| HP 15-ay116ng | |
| Acer Extensa 2520-59CD | |
| Lenovo B50-50 80S2000QGE | |
| Lenovo Ideapad 500-15ACZ | |
| Lenovo G51-35 80M8002HGE | |
| Rendering Single 32Bit | |
| HP 15-ay116ng | |
| Acer Extensa 2520-59CD | |
| Lenovo B50-50 80S2000QGE | |
| Lenovo Ideapad 500-15ACZ | |
| Lenovo G51-35 80M8002HGE | |
| Geekbench 3 | |
| 32 Bit Single-Core Score | |
| HP 15-ay116ng | |
| Acer Extensa 2520-59CD | |
| Lenovo Ideapad 500-15ACZ | |
| Lenovo B50-50 80S2000QGE | |
| 32 Bit Multi-Core Score | |
| HP 15-ay116ng | |
| Acer Extensa 2520-59CD | |
| Lenovo Ideapad 500-15ACZ | |
| Lenovo B50-50 80S2000QGE | |
| Geekbench 4.0 | |
| 64 Bit Single-Core Score | |
| HP 15-ay116ng | |
| 64 Bit Multi-Core Score | |
| HP 15-ay116ng | |
| JetStream 1.1 - Total Score | |
| HP 15-ay116ng | |
| HP 250 G5 SP X0N33EA | |
| Acer Extensa 2520-59CD | |
| Lenovo B50-50 80S2000QGE | |
| Lenovo Ideapad 500-15ACZ | |
| Lenovo G51-35 80M8002HGE | |
| Octane V2 - Total Score | |
| HP 15-ay116ng | |
| Lenovo B50-50 80S2000QGE | |
| Lenovo Ideapad 500-15ACZ | |
| HP 250 G5 SP X0N33EA | |
| Mozilla Kraken 1.1 - Total | |
| HP 250 G5 SP X0N33EA | |
| Lenovo Ideapad 500-15ACZ | |
| Lenovo B50-50 80S2000QGE | |
| HP 15-ay116ng | |
* ... smaller is better
| PCMark 7 Score | 4977 points | |
| PCMark 8 Home Score Accelerated v2 | 3315 points | |
| PCMark 8 Creative Score Accelerated v2 | 4338 points | |
| PCMark 8 Work Score Accelerated v2 | 4587 points | |
Help | ||
| PCMark 8 | |
| Home Score Accelerated v2 | |
| Dell Latitude 15-3570 | |
| HP 250 G5 SP X0N33EA | |
| HP 15-ay116ng | |
| Lenovo B50-50 80S2000QGE | |
| Acer Extensa 2520-59CD | |
| Work Score Accelerated v2 | |
| HP 15-ay116ng | |
| Dell Latitude 15-3570 | |
| HP 250 G5 SP X0N33EA | |
| Lenovo B50-50 80S2000QGE | |

| HP 15-ay116ng Samsung CM871a MZNTY256HDHP | HP 250 G5 SP X0N33EA SanDisk Z400s SD8SNAT-256G | Acer Extensa 2520-59CD Toshiba MQ01ABF050 | Lenovo B50-50 80S2000QGE Toshiba MQ02ABF050H (SSHD 500 + 8 GB) | Dell Latitude 15-3570 Samsung CM871 MZNLF128HCHP | |
|---|---|---|---|---|---|
| CrystalDiskMark 3.0 | -21% | -92% | -92% | -56% | |
| Read Seq | 501 | 509 2% | 104.7 -79% | 102.5 -80% | 453.2 -10% |
| Write Seq | 483.9 | 322.1 -33% | 95.7 -80% | 90.7 -81% | 137.7 -72% |
| Read 512 | 413.8 | 321.2 -22% | 33 -92% | 32.58 -92% | 308.5 -25% |
| Write 512 | 294.9 | 289.4 -2% | 38.3 -87% | 35.65 -88% | 134.1 -55% |
| Read 4k | 34.91 | 20.99 -40% | 0.375 -99% | 0.426 -99% | 19.06 -45% |
| Write 4k | 95.7 | 88 -8% | 0.782 -99% | 0.64 -99% | 21.31 -78% |
| Read 4k QD32 | 370.9 | 141.3 -62% | 0.675 -100% | 0.987 -100% | 93.5 -75% |
| Write 4k QD32 | 243.6 | 228.5 -6% | 0.769 -100% | 0.645 -100% | 23.3 -90% |
| 3DMark 06 Standard Score | 8012 points | |
| 3DMark 11 Performance | 1511 points | |
| 3DMark Ice Storm Standard Score | 49743 points | |
| 3DMark Cloud Gate Standard Score | 5542 points | |
| 3DMark Fire Strike Score | 744 points | |
Help | ||
| 3DMark 11 - 1280x720 Performance GPU | |
| HP Pavilion 15-aw004ng | |
| HP ProBook 470 G3 | |
| HP 15-ay116ng | |
| Dell Latitude 15-3570 | |
| HP 250 G5 SP X0N33EA | |
| Acer Extensa 2520-59CD | |
| Lenovo B50-50 80S2000QGE | |
| 3DMark | |
| 1280x720 Cloud Gate Standard Graphics | |
| HP 15-ay116ng | |
| HP 250 G5 SP X0N33EA | |
| HP Pavilion 15-aw004ng | |
| HP ProBook 470 G3 | |
| Dell Latitude 15-3570 | |
| Lenovo B50-50 80S2000QGE | |
| 1920x1080 Fire Strike Graphics | |
| HP ProBook 470 G3 | |
| HP Pavilion 15-aw004ng | |
| HP 15-ay116ng | |
| Lenovo B50-50 80S2000QGE | |
| low | med. | high | ultra | |
| Tomb Raider (2013) | 67.6 | 33.9 | 19.5 | 9.6 |
| BioShock Infinite (2013) | 45.3 | 25.3 | 20.9 | 6.5 |
| Battlefield 4 (2013) | 31.1 | 24.9 | 16.4 | 5 |
Noise Level
| Idle |
| 31.3 / 31.3 / 31.3 dB(A) |
| DVD |
| 38.4 / dB(A) |
| Load |
| 35.6 / 36.15 dB(A) |
 | ||
30 dB silent 40 dB(A) audible 50 dB(A) loud |
||
min: | ||
| HP 15-ay116ng i5-7200U, HD Graphics 620 | HP 250 G5 SP X0N33EA 6200U, HD Graphics 520 | Acer Extensa 2520-59CD 6200U, HD Graphics 520 | Lenovo B50-50 80S2000QGE 5005U, HD Graphics 5500 | Dell Latitude 15-3570 6200U, HD Graphics 520 | |
|---|---|---|---|---|---|
| Noise | -8% | -1% | -1% | 2% | |
| off / environment * | 30.5 | 31.6 -4% | 31.2 -2% | 31.2 -2% | 31 -2% |
| Idle Minimum * | 31.3 | 34.5 -10% | 31.5 -1% | 32.5 -4% | 31 1% |
| Idle Average * | 31.3 | 34.5 -10% | 31.9 -2% | 32.5 -4% | 31 1% |
| Idle Maximum * | 31.3 | 34.5 -10% | 31.9 -2% | 32.7 -4% | 31 1% |
| Load Average * | 35.6 | 39 -10% | 34.2 4% | 34.2 4% | 34.2 4% |
| Load Maximum * | 36.15 | 38.3 -6% | 36.8 -2% | 34.6 4% | 34.3 5% |
* ... smaller is better
(+) The maximum temperature on the upper side is 33.8 °C / 93 F, compared to the average of 34.2 °C / 94 F, ranging from 21.2 to 62.5 °C for the class Office.
(+) The bottom heats up to a maximum of 36.6 °C / 98 F, compared to the average of 36.7 °C / 98 F
(+) In idle usage, the average temperature for the upper side is 22.4 °C / 72 F, compared to the device average of 29.5 °C / 85 F.
(+) The palmrests and touchpad are cooler than skin temperature with a maximum of 31.9 °C / 89.4 F and are therefore cool to the touch.
(-) The average temperature of the palmrest area of similar devices was 27.7 °C / 81.9 F (-4.2 °C / -7.5 F).
| HP 15-ay116ng i5-7200U, HD Graphics 620 | HP 250 G5 SP X0N33EA 6200U, HD Graphics 520 | Acer Extensa 2520-59CD 6200U, HD Graphics 520 | Lenovo B50-50 80S2000QGE 5005U, HD Graphics 5500 | Dell Latitude 15-3570 6200U, HD Graphics 520 | |
|---|---|---|---|---|---|
| Heat | 7% | -14% | -5% | -27% | |
| Maximum Upper Side * | 33.8 | 31.1 8% | 33.2 2% | 34.6 -2% | 36.1 -7% |
| Maximum Bottom * | 36.6 | 31.8 13% | 37.3 -2% | 35.6 3% | 47 -28% |
| Idle Upper Side * | 23.6 | 22.9 3% | 28.7 -22% | 26.7 -13% | 31.7 -34% |
| Idle Bottom * | 23.8 | 22.6 5% | 32 -34% | 26 -9% | 32.9 -38% |
* ... smaller is better
HP 15-ay116ng audio analysis
(±) | speaker loudness is average but good (75 dB)
Bass 100 - 315 Hz
(-) | nearly no bass - on average 27.3% lower than median
(±) | linearity of bass is average (14.7% delta to prev. frequency)
Mids 400 - 2000 Hz
(+) | balanced mids - only 2.6% away from median
(+) | mids are linear (5.8% delta to prev. frequency)
Highs 2 - 16 kHz
(±) | higher highs - on average 6.9% higher than median
(+) | highs are linear (5.4% delta to prev. frequency)
Overall 100 - 16.000 Hz
(±) | linearity of overall sound is average (23.4% difference to median)
Compared to same class
» 62% of all tested devices in this class were better, 9% similar, 29% worse
» The best had a delta of 7%, average was 22%, worst was 53%
Compared to all devices tested
» 65% of all tested devices were better, 7% similar, 28% worse
» The best had a delta of 4%, average was 25%, worst was 134%
Apple MacBook 12 (Early 2016) 1.1 GHz audio analysis
(+) | speakers can play relatively loud (83.6 dB)
Bass 100 - 315 Hz
(±) | reduced bass - on average 11.3% lower than median
(±) | linearity of bass is average (14.2% delta to prev. frequency)
Mids 400 - 2000 Hz
(+) | balanced mids - only 2.4% away from median
(+) | mids are linear (5.5% delta to prev. frequency)
Highs 2 - 16 kHz
(+) | balanced highs - only 2% away from median
(+) | highs are linear (4.5% delta to prev. frequency)
Overall 100 - 16.000 Hz
(+) | overall sound is linear (10.2% difference to median)
Compared to same class
» 5% of all tested devices in this class were better, 2% similar, 93% worse
» The best had a delta of 5%, average was 19%, worst was 53%
Compared to all devices tested
» 3% of all tested devices were better, 1% similar, 96% worse
» The best had a delta of 4%, average was 25%, worst was 134%
| Off / Standby | |
| Idle | |
| Load |
|
| HP 15-ay116ng i5-7200U, HD Graphics 620 | HP 250 G5 SP X0N33EA 6200U, HD Graphics 520 | Acer Extensa 2520-59CD 6200U, HD Graphics 520 | Lenovo B50-50 80S2000QGE 5005U, HD Graphics 5500 | Dell Latitude 15-3570 6200U, HD Graphics 520 | |
|---|---|---|---|---|---|
| Power Consumption | 0% | -54% | -20% | -14% | |
| Idle Minimum * | 3.2 | 3.6 -13% | 5.8 -81% | 5.5 -72% | 4.9 -53% |
| Idle Average * | 6.3 | 6 5% | 12.6 -100% | 7.6 -21% | 7.2 -14% |
| Idle Maximum * | 7.4 | 6.4 14% | 12.8 -73% | 8.5 -15% | 7.5 -1% |
| Load Average * | 24 | 26 -8% | 27.6 -15% | 24.5 -2% | 25.4 -6% |
| Load Maximum * | 29 | 28.1 3% | 30 -3% | 25.4 12% | 28 3% |
* ... smaller is better
| HP 15-ay116ng i5-7200U, HD Graphics 620, 41 Wh | HP 250 G5 SP X0N33EA 6200U, HD Graphics 520, 41 Wh | Acer Extensa 2520-59CD 6200U, HD Graphics 520, 37 Wh | Lenovo B50-50 80S2000QGE 5005U, HD Graphics 5500, 32 Wh | Dell Latitude 15-3570 6200U, HD Graphics 520, 65 Wh | |
|---|---|---|---|---|---|
| Battery Runtime | -11% | -24% | -28% | 43% | |
| Reader / Idle | 869 | 634 -27% | 1024 18% | ||
| H.264 | 430 | 313 -27% | |||
| WiFi v1.3 | 412 | 347 -16% | 315 -24% | 295 -28% | 542 32% |
| Load | 87 | 109 25% | 157 80% |
Pros
Cons
惠普的这台15.6寸笔记本电脑给我们带来了十分优秀的整体印象。由于搭配了Kaby Lake处理器,它可以适合大部分常见用途的需要——不管是现在还是数年之后。用户也可以更换固态硬盘,不过这需要打开机身才可以实现。它搭配的硬盘可以满足日常使用的需要。同时它也提供了十分优秀的电池续航。磨砂屏幕具备全高清分辨率,不过亮度较低且对比度十分不足。另外它的可视角度也不太稳定。不过,考虑到价位,这块屏幕也不算是无法接受。
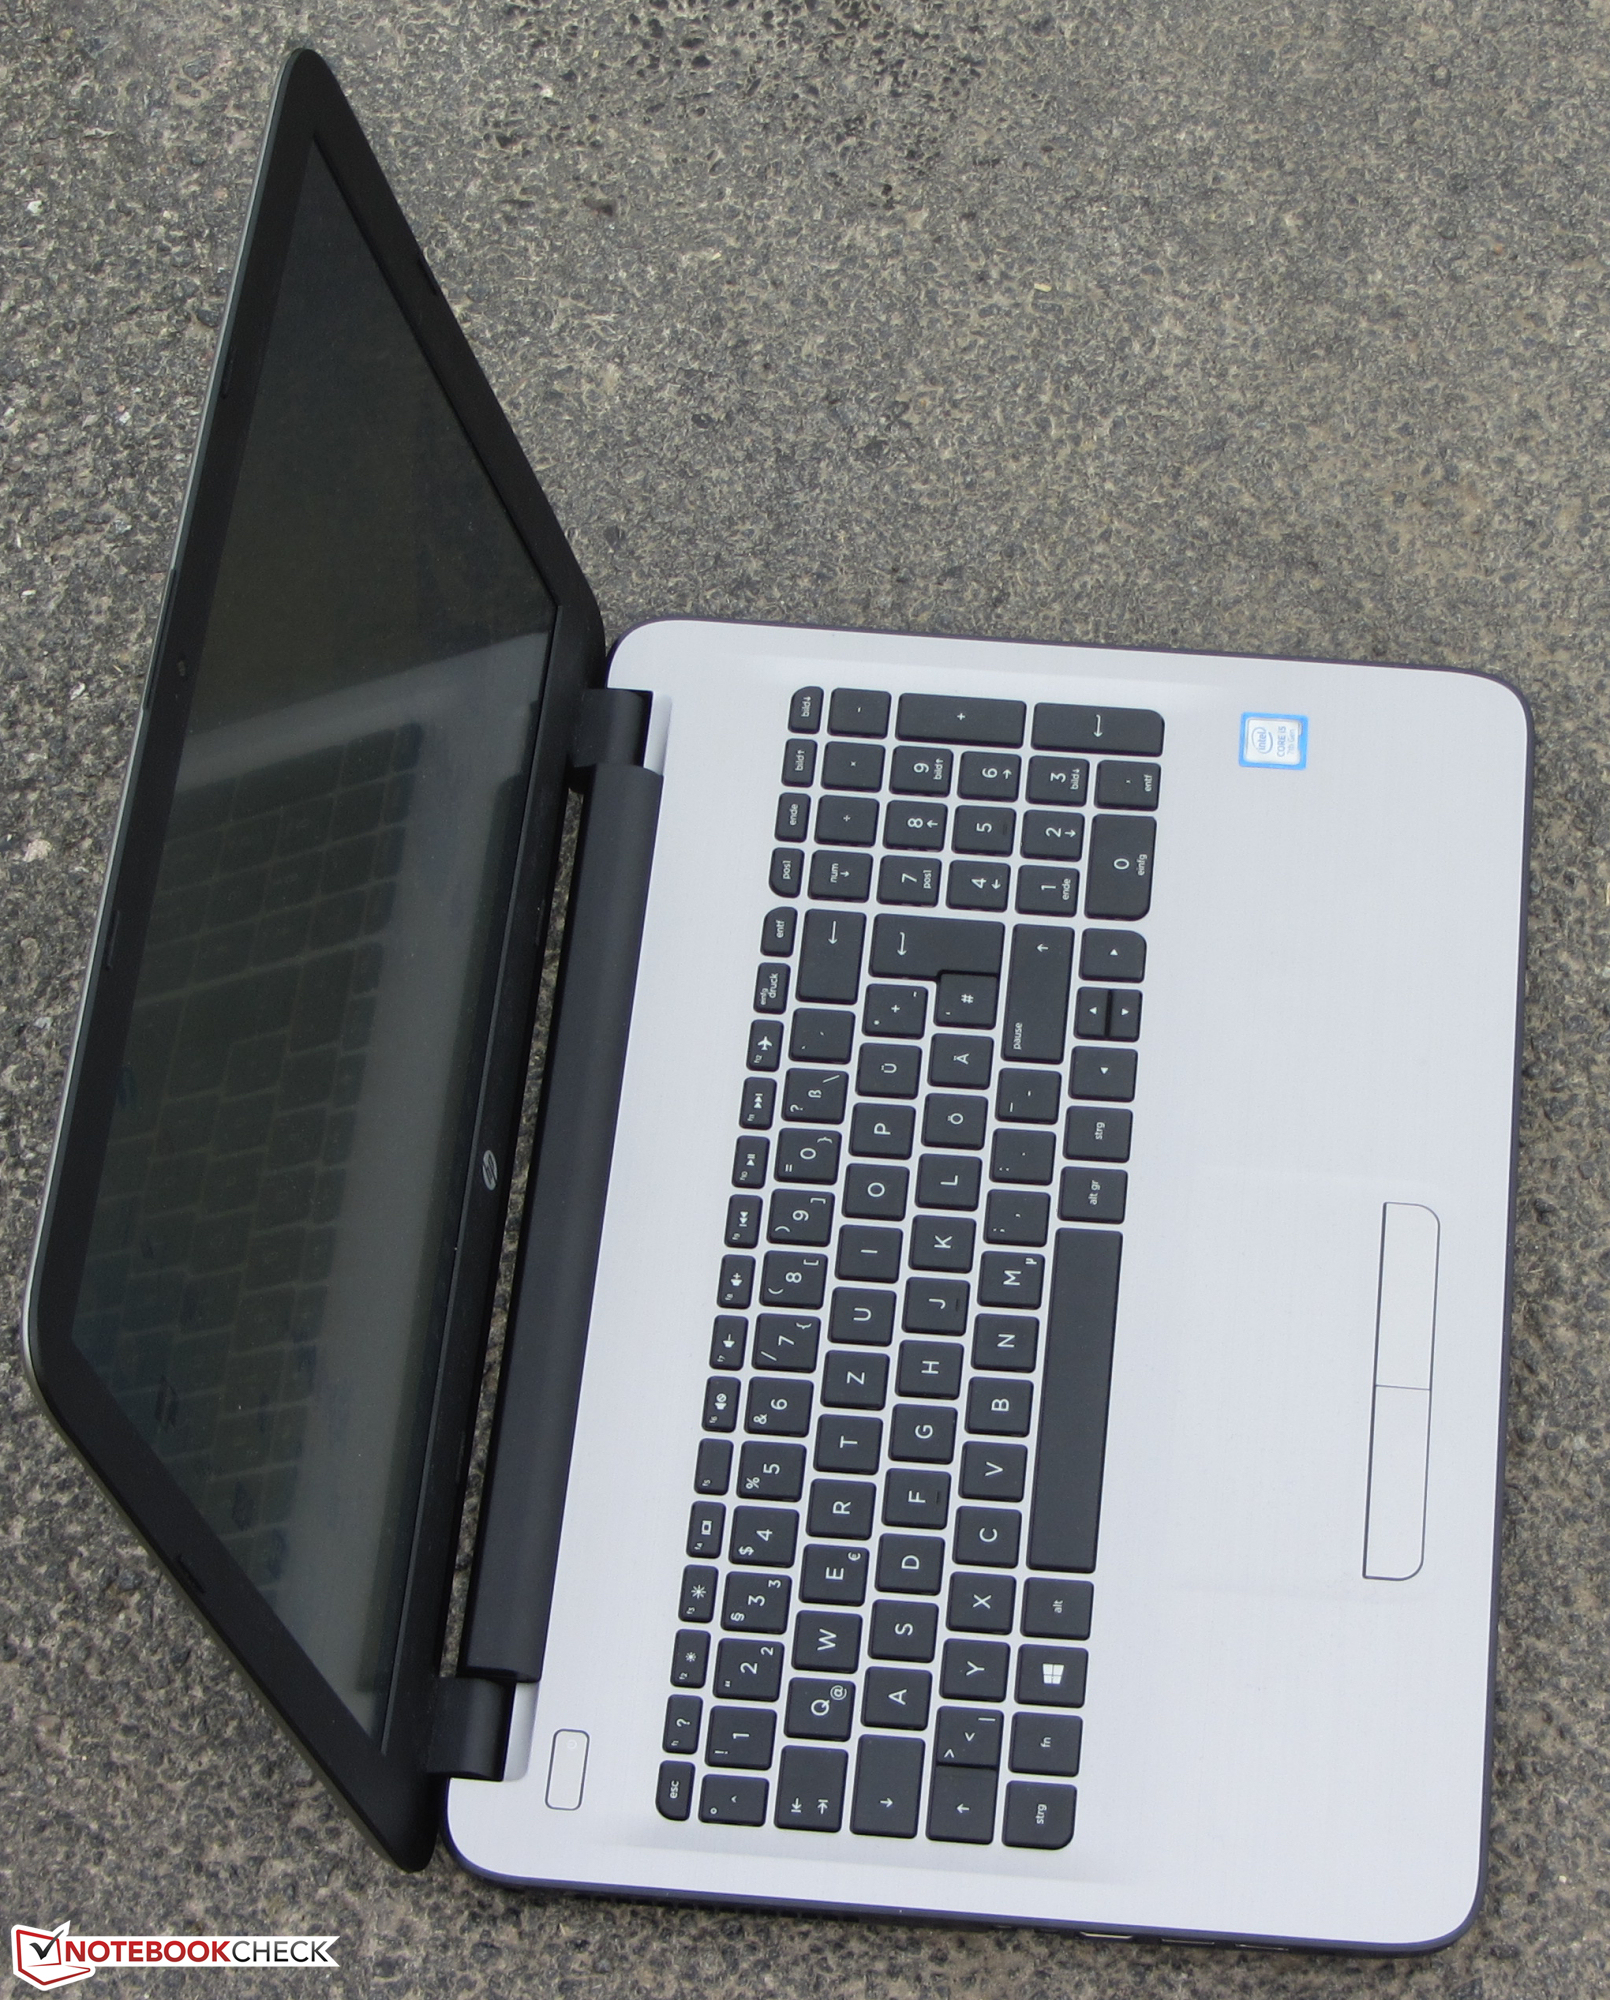
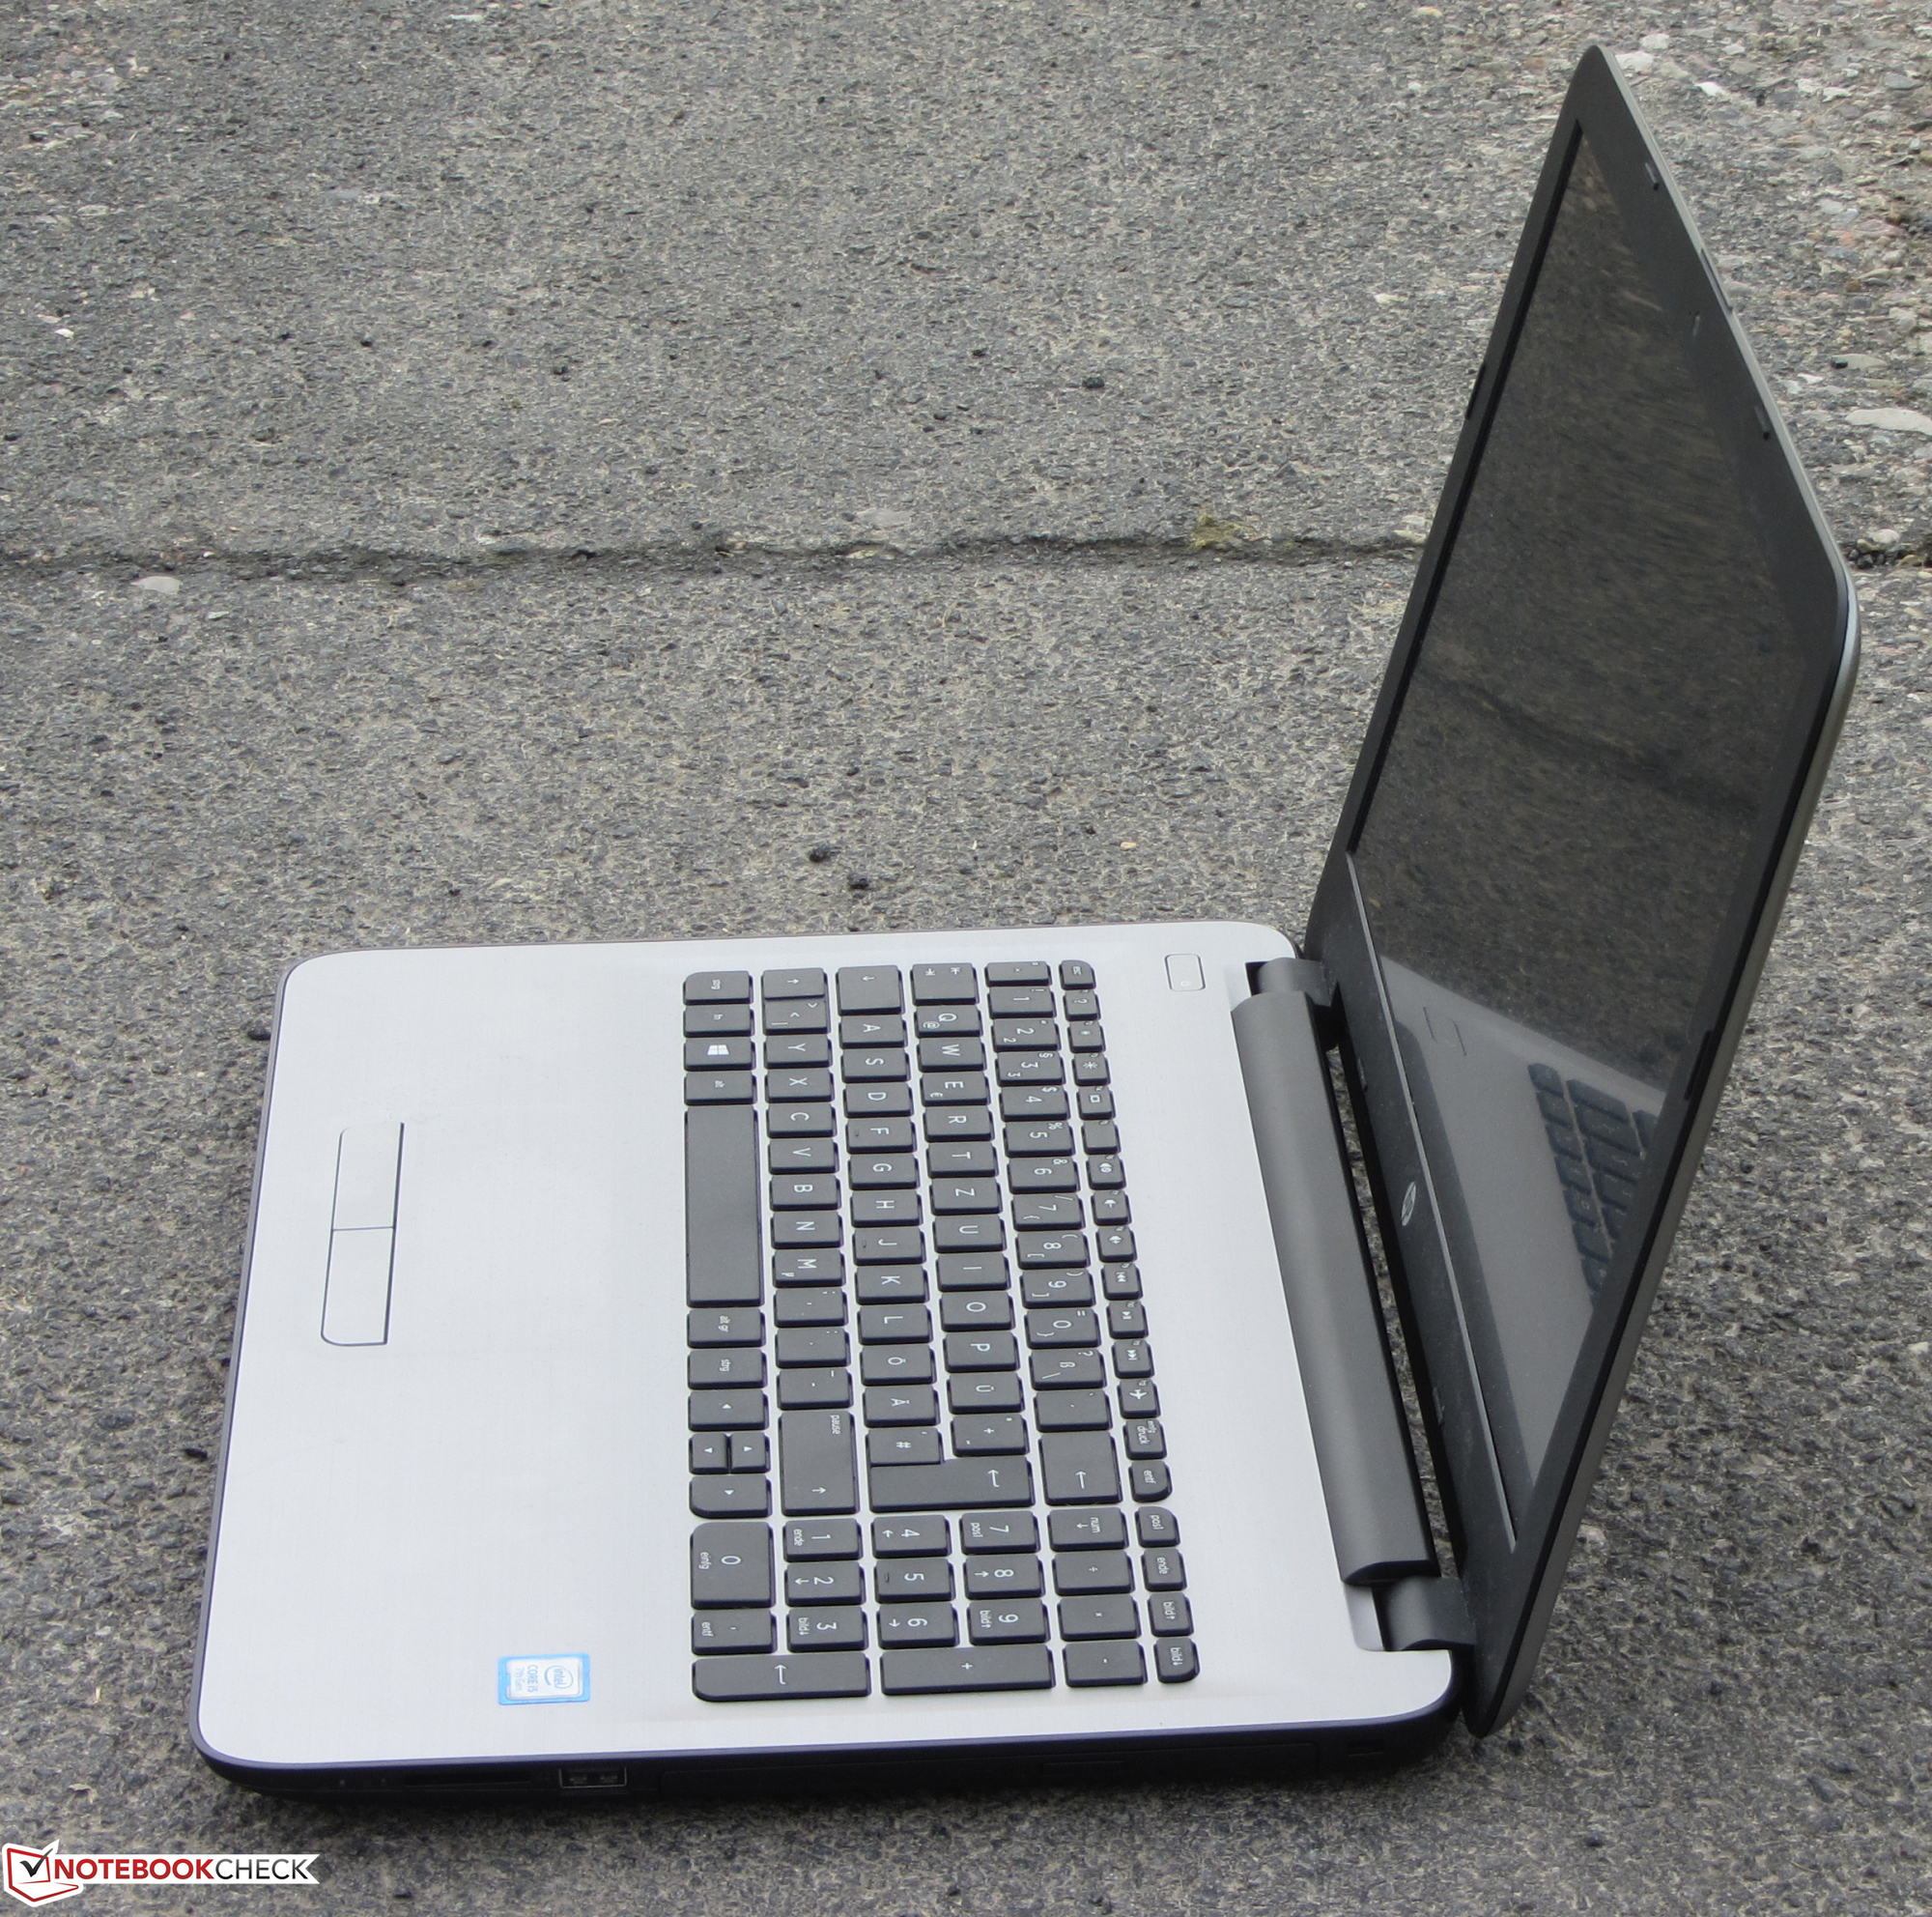
15-ay116ng是惠普为产品线增加的一台全功能型办公笔记本电脑,它提供了十分优秀的性价比。
这台笔记本电脑的价签为500欧元(约3592人民币)。大部分的成本都用在了处理器,屏幕和固态硬盘上。这意味着其他部分它都节省了预算:这台笔记本电脑只有一年的质保,就算是在实惠型设备中,两年质保也是近年来的标准。另外,它仅搭配了高速以太网接口。如果千兆以太网对你来说不可或缺的话,就需要另外看看别的设备了。这台设备的无线网卡也不支持高速AC标准。
注:本文是基于完整评测的缩减版本,阅读完整的英文评测,请点击这里。
HP 15-ay116ng
-
11/25/2016 v5.1(old)
Sascha Mölck